Fig. 2
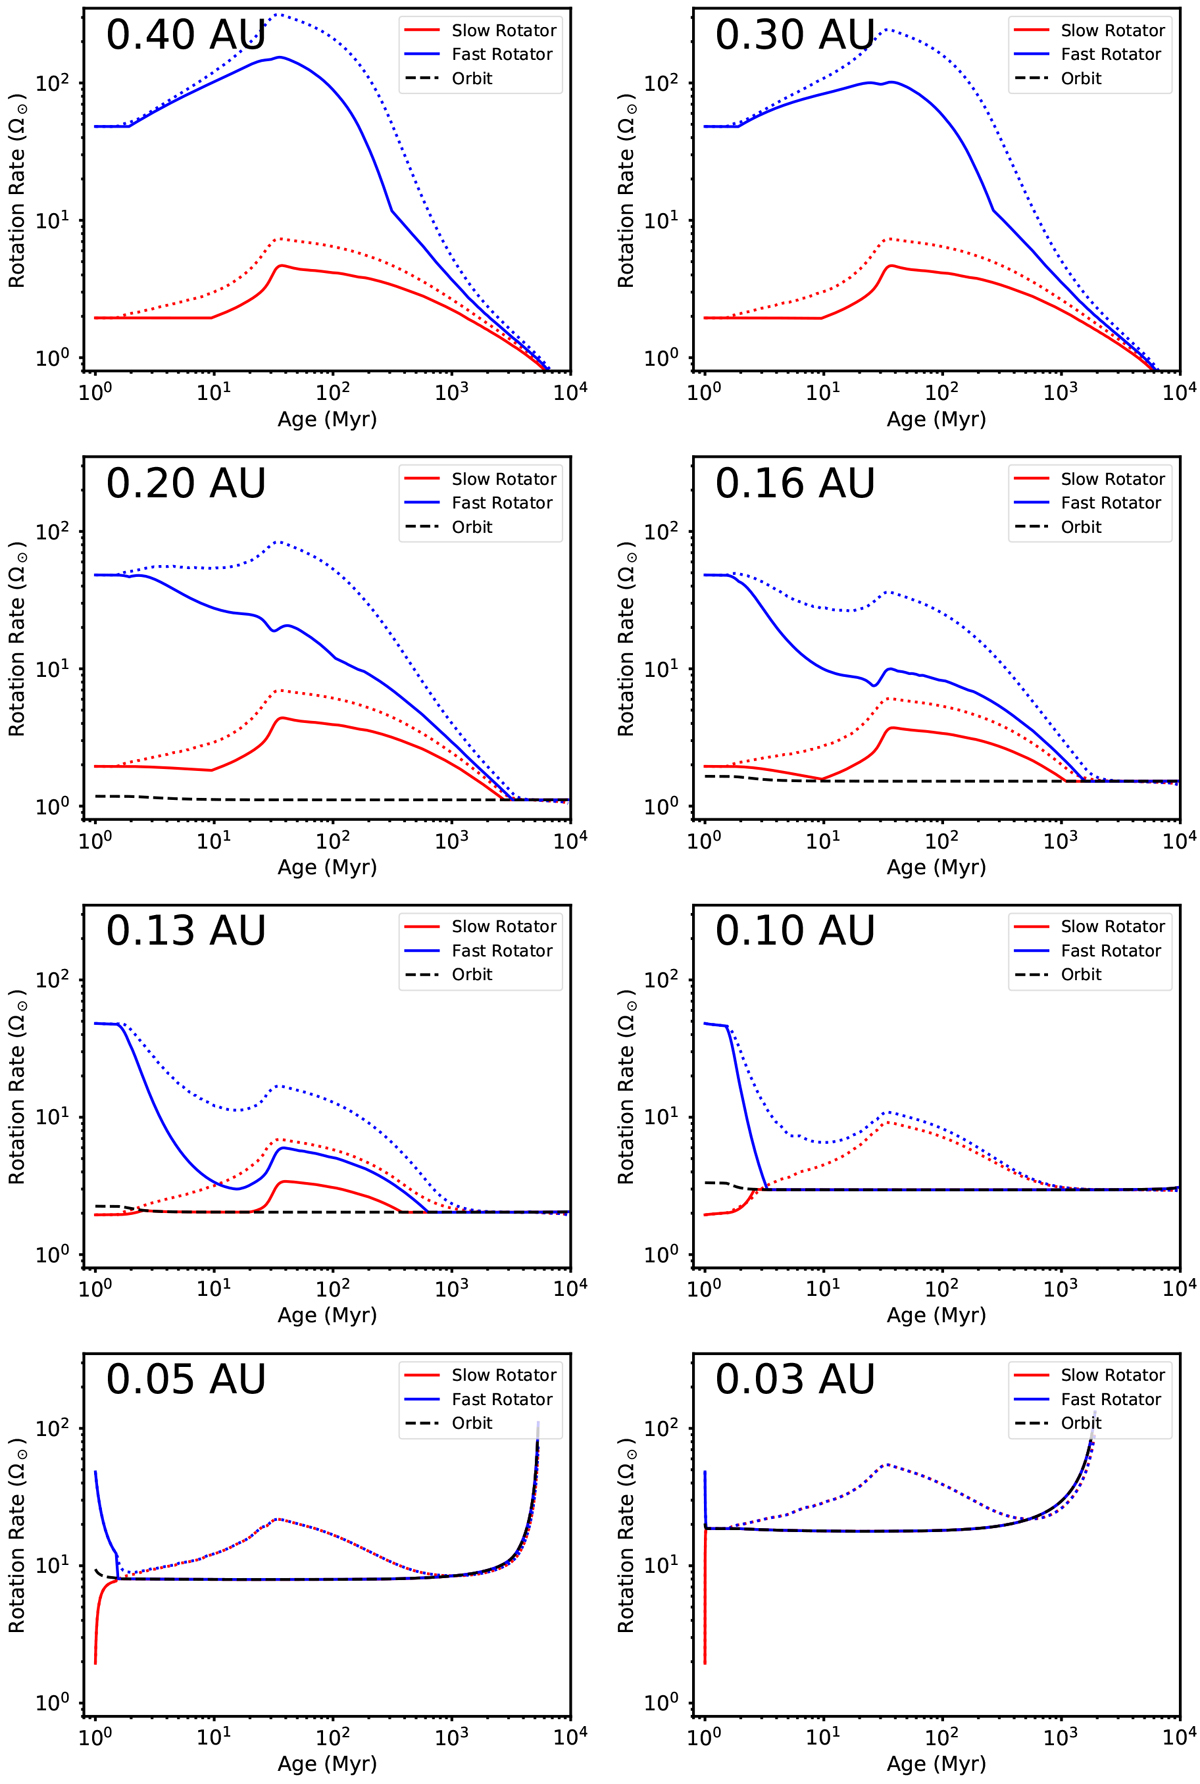
Rotational evolution of two solar mass stars in tight binary systems with different initial orbital separations. In each system, the two stars start with very different initial rotation rates. The initial orbital separations are written in the top left of each panel. The dashed black lines show the orbital angular velocity. In several panels, the slow rotator line is mostly covered by the fast rotator line.
Current usage metrics show cumulative count of Article Views (full-text article views including HTML views, PDF and ePub downloads, according to the available data) and Abstracts Views on Vision4Press platform.
Data correspond to usage on the plateform after 2015. The current usage metrics is available 48-96 hours after online publication and is updated daily on week days.
Initial download of the metrics may take a while.