Fig. 1.
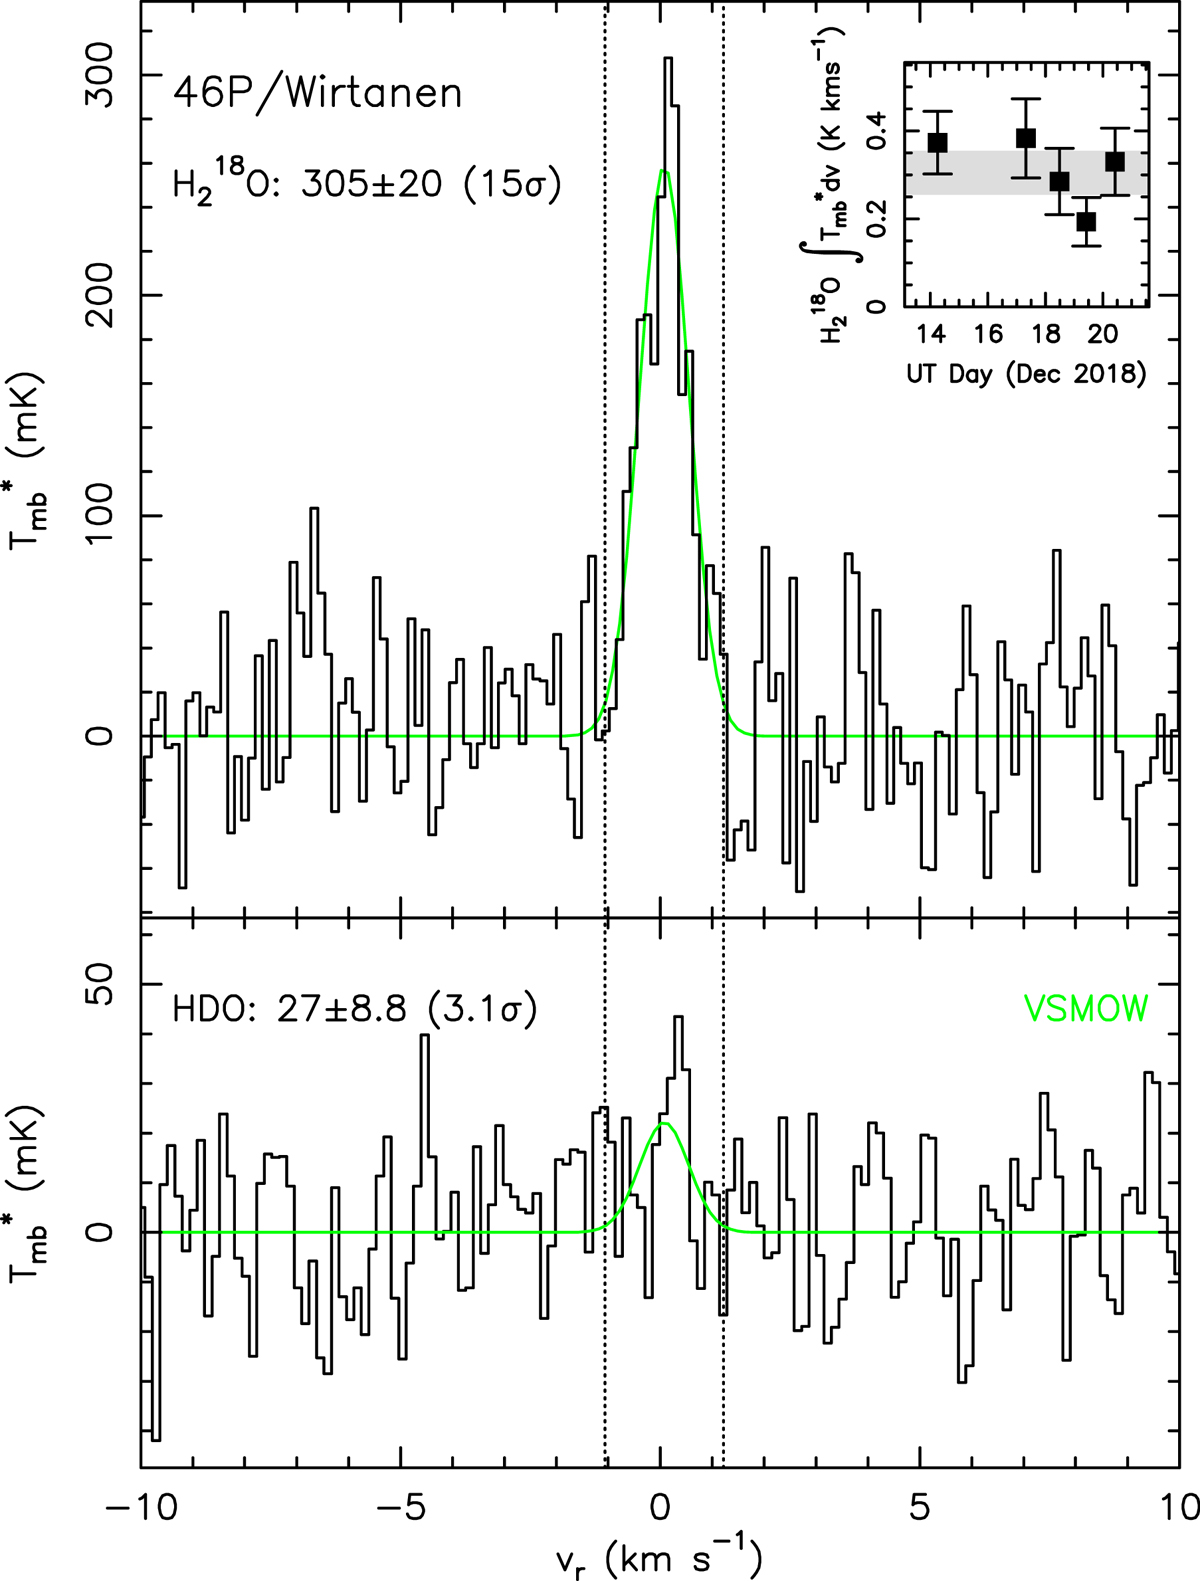
Spectra of the water isotopologues in comet 46P/Wirtanen. The 11, 0 − 10, 1 ![]() and HDO transitions are shown in the upper and lower panels, respectively. The intensity scale is the main beam brightness temperature. The spectral resolution is 0.24 MHz, corresponding to approximately 0.14 km s−1. A Gaussian fit to the
and HDO transitions are shown in the upper and lower panels, respectively. The intensity scale is the main beam brightness temperature. The spectral resolution is 0.24 MHz, corresponding to approximately 0.14 km s−1. A Gaussian fit to the ![]() spectrum (green line, upper panel) gives a line center velocity νo = 0.08 ± 0.04 km s−1 and a full width at half maximum line width Δν = 1.09 ± 0.09 km s−1. Vertical dotted lines indicate the velocity range used in computations of the integrated line intensities (–1.04 to 1.2 km s−1). The green line in the lower panel shows the expected HDO line intensity assuming D/H equal to VSMOW. The inset in the upper panel shows the evolution of the
spectrum (green line, upper panel) gives a line center velocity νo = 0.08 ± 0.04 km s−1 and a full width at half maximum line width Δν = 1.09 ± 0.09 km s−1. Vertical dotted lines indicate the velocity range used in computations of the integrated line intensities (–1.04 to 1.2 km s−1). The green line in the lower panel shows the expected HDO line intensity assuming D/H equal to VSMOW. The inset in the upper panel shows the evolution of the ![]() integrated line intensity as a function of UT time. Error bars include statistical and calibration uncertainties, combined in quadrature, and the gray shaded area shows the corresponding uncertainty on the average
integrated line intensity as a function of UT time. Error bars include statistical and calibration uncertainties, combined in quadrature, and the gray shaded area shows the corresponding uncertainty on the average ![]() line intensity (ensemble average).
line intensity (ensemble average).
Current usage metrics show cumulative count of Article Views (full-text article views including HTML views, PDF and ePub downloads, according to the available data) and Abstracts Views on Vision4Press platform.
Data correspond to usage on the plateform after 2015. The current usage metrics is available 48-96 hours after online publication and is updated daily on week days.
Initial download of the metrics may take a while.