Fig. A.1.
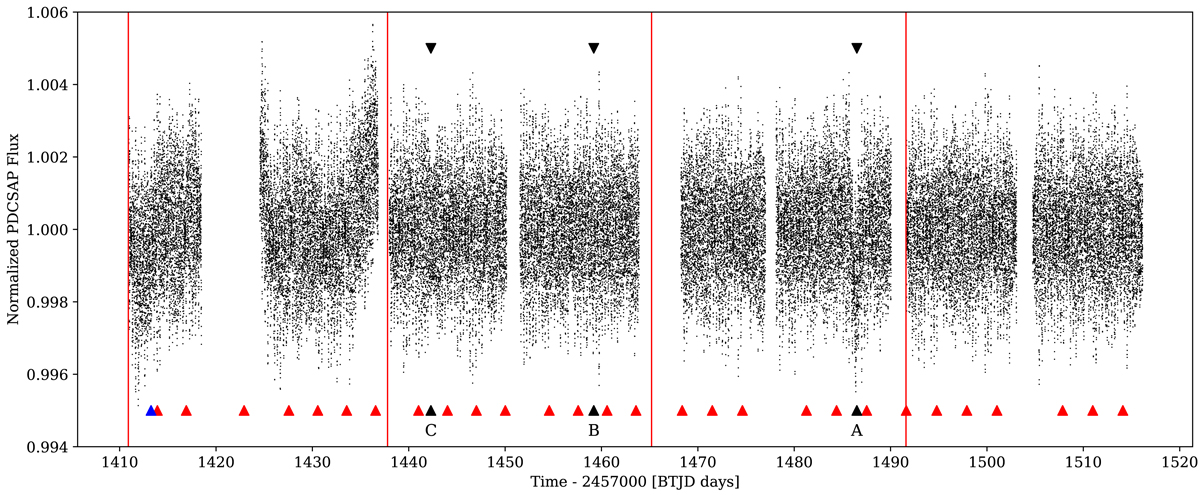
Full PDCSAP light curve of β Pictoris used in this analysis. The red vertical lines indicate the starts of Sectors 4 through 7. The black triangles point to the three identified decreases in flux, labelled A,B,C in decreasing signal to noise. The time of momentum dumps are indicated with red triangles; a small change in spacecraft pointing at the beginning of Sector 4 (due to an updated guide star table) is shown with a blue triangle.
Current usage metrics show cumulative count of Article Views (full-text article views including HTML views, PDF and ePub downloads, according to the available data) and Abstracts Views on Vision4Press platform.
Data correspond to usage on the plateform after 2015. The current usage metrics is available 48-96 hours after online publication and is updated daily on week days.
Initial download of the metrics may take a while.