Free Access
Fig. 3.
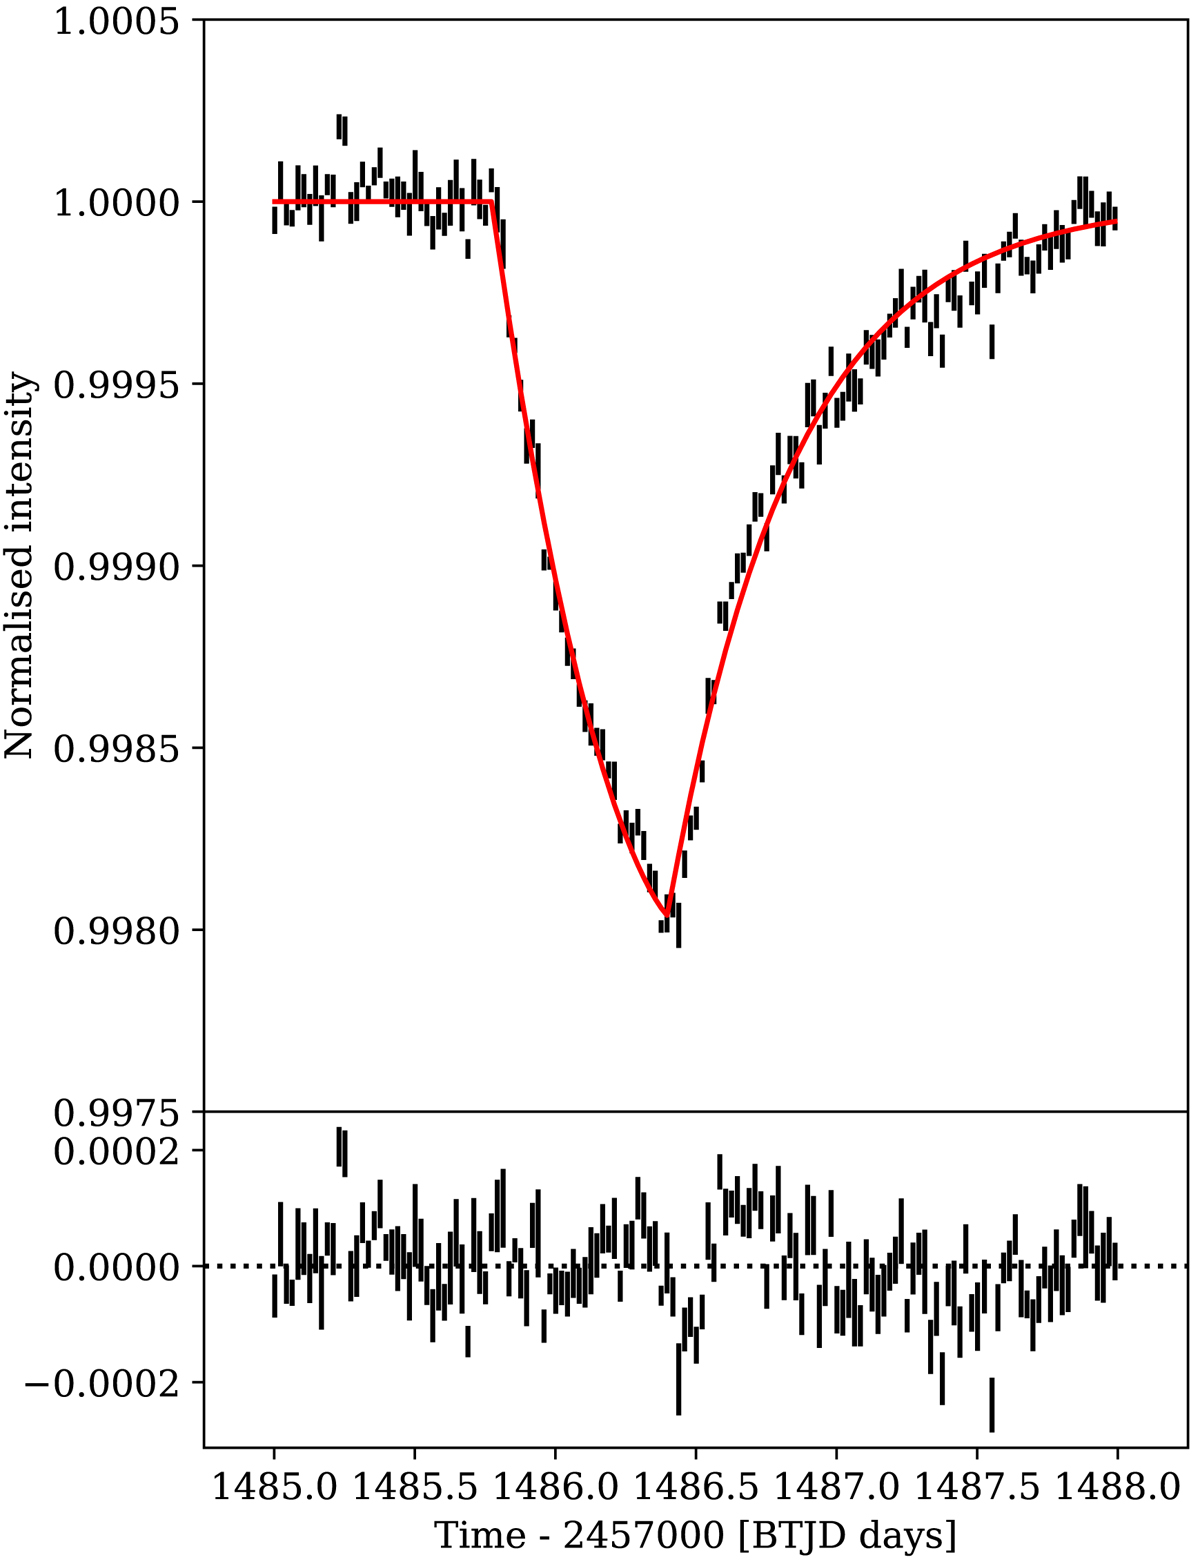
Best-fit comet model. Upper panel: binned photometry showing the largest transit event. The vertical dashes show the error bars on the photometry. The red line shows the best-fit model for b = 0 (i.e. the median of the parameters shown in Fig. 4). Lower panel: residuals from the fit.
Current usage metrics show cumulative count of Article Views (full-text article views including HTML views, PDF and ePub downloads, according to the available data) and Abstracts Views on Vision4Press platform.
Data correspond to usage on the plateform after 2015. The current usage metrics is available 48-96 hours after online publication and is updated daily on week days.
Initial download of the metrics may take a while.