Fig. 4.
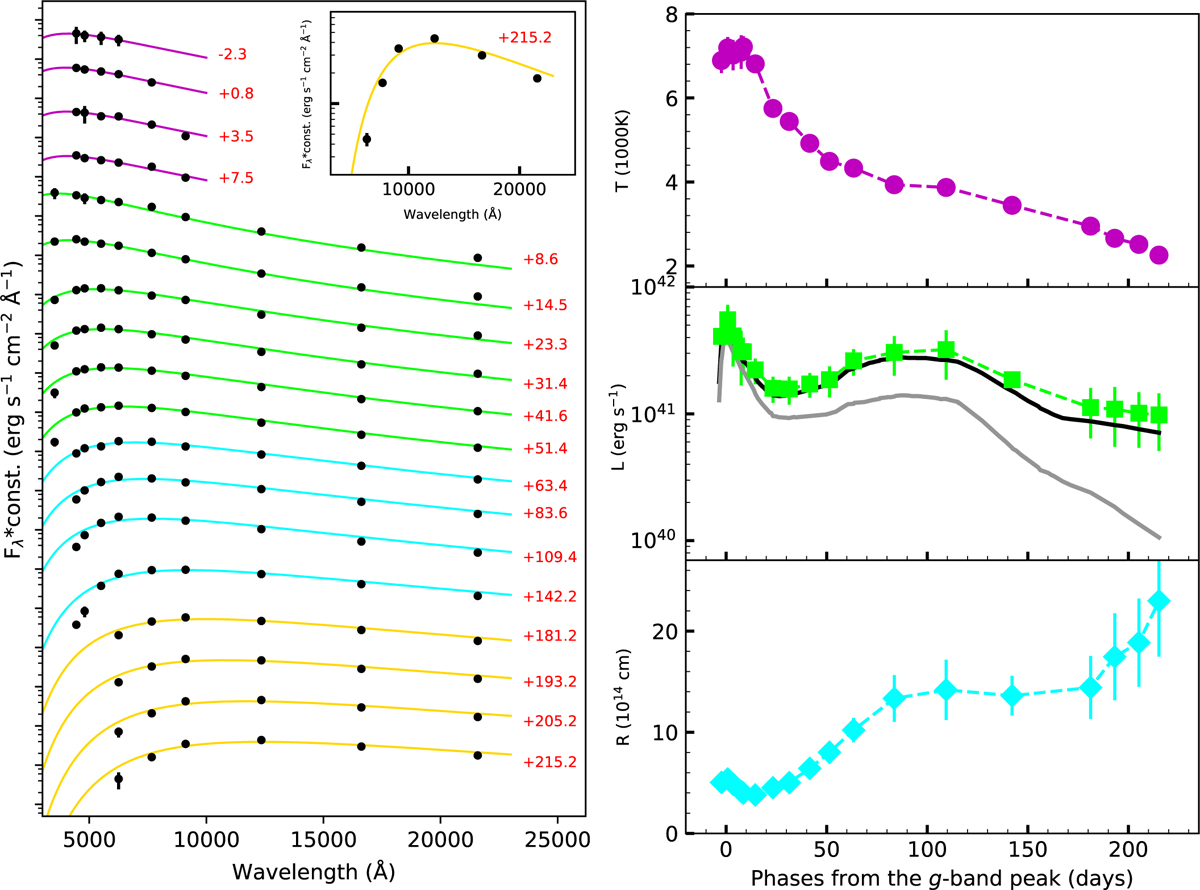
Left: evolution of the SED at some selected epochs spanning the entire evolution of AT 2017jfs. Top-right: evolution of the effective temperature. Middle-right: bolometric light curve of AT 2017jfs (green squares and dashed line), compared with the uvoir (black solid line) and opt (gray solid line) pseudo-bolometric curves (see text). Bottom-right: evolution of the photospheric radius of AT 2017jfs.
Current usage metrics show cumulative count of Article Views (full-text article views including HTML views, PDF and ePub downloads, according to the available data) and Abstracts Views on Vision4Press platform.
Data correspond to usage on the plateform after 2015. The current usage metrics is available 48-96 hours after online publication and is updated daily on week days.
Initial download of the metrics may take a while.