Fig. 3.
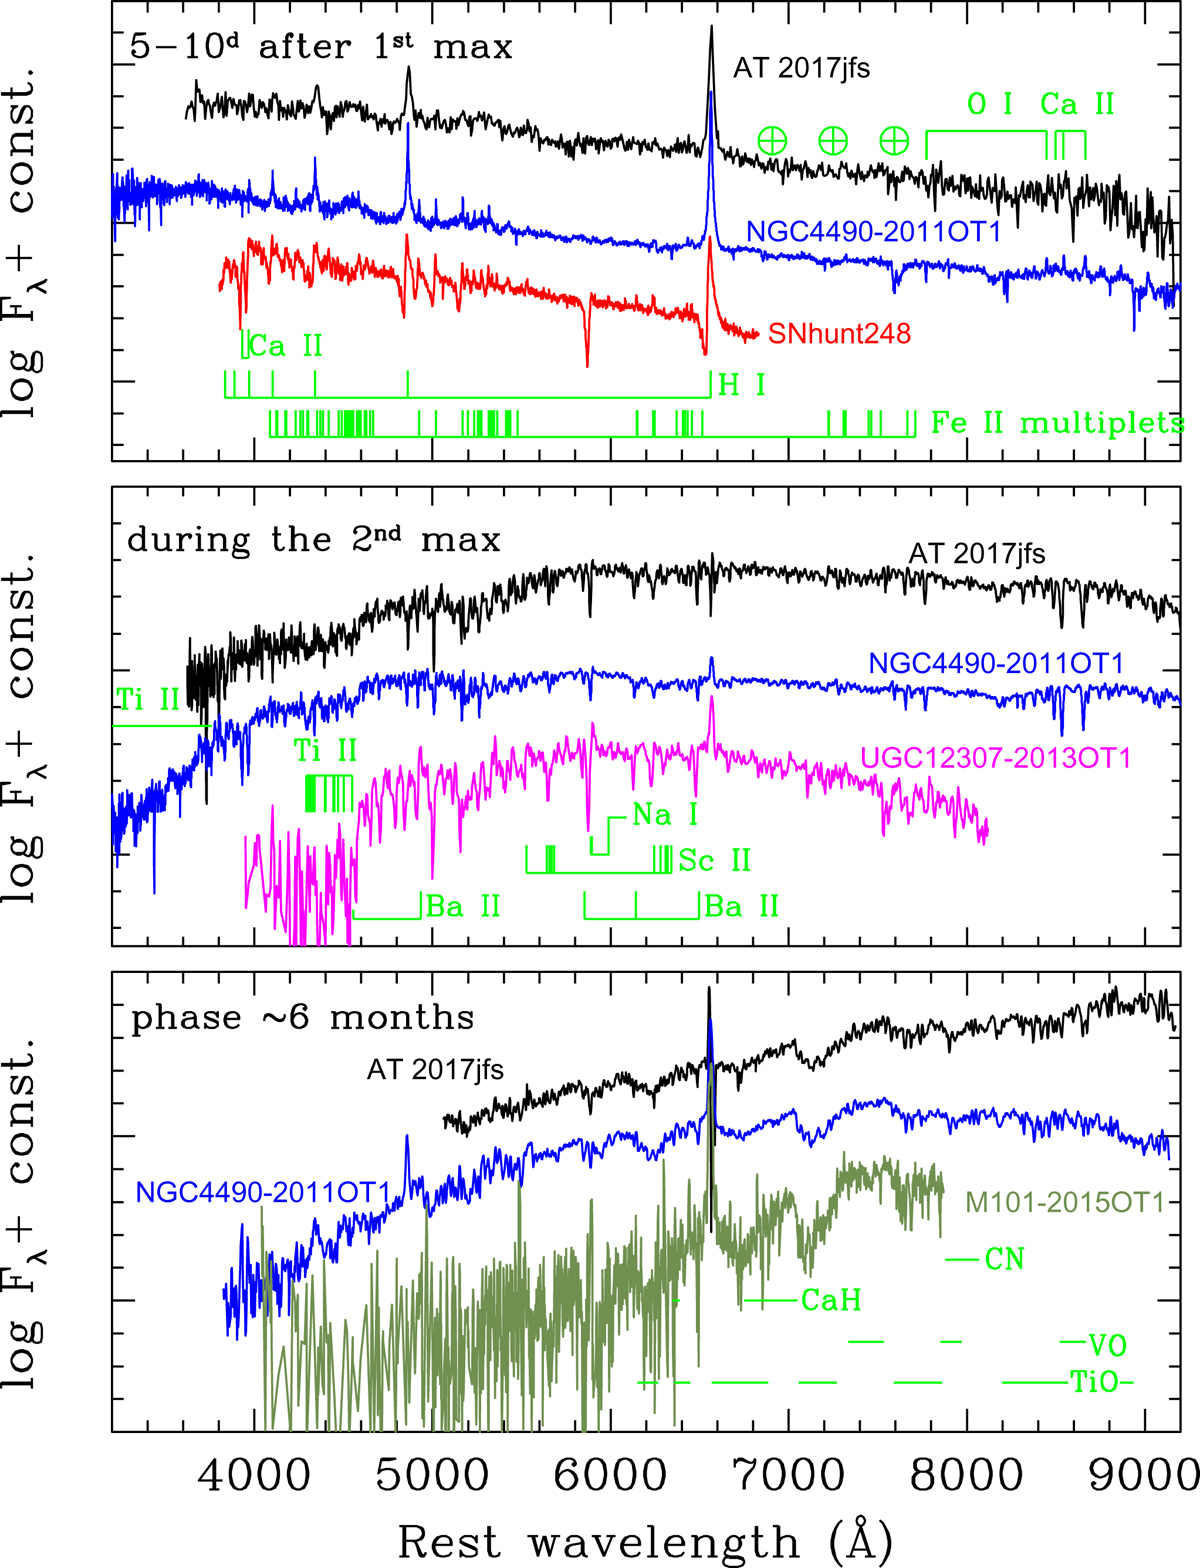
Line identification in the spectra of AT 2017jfs and a few comparison LRNe at three representative phases: a few days after the blue peak (top panel), around the red peak (middle panel), and at late phases (about 5−6 months after the blue peak; bottom panel). The spectra of the comparison objects are taken from Pastorello et al. (2019), Blagorodnova et al. (2017), and Kankare et al. (2015). The identification of the molecular bands is performed following Kirkpatrick et al. (1991), Valenti et al. (1998), Martini et al. (1999), and Barsukova et al. (2014).
Current usage metrics show cumulative count of Article Views (full-text article views including HTML views, PDF and ePub downloads, according to the available data) and Abstracts Views on Vision4Press platform.
Data correspond to usage on the plateform after 2015. The current usage metrics is available 48-96 hours after online publication and is updated daily on week days.
Initial download of the metrics may take a while.