Fig. 2.
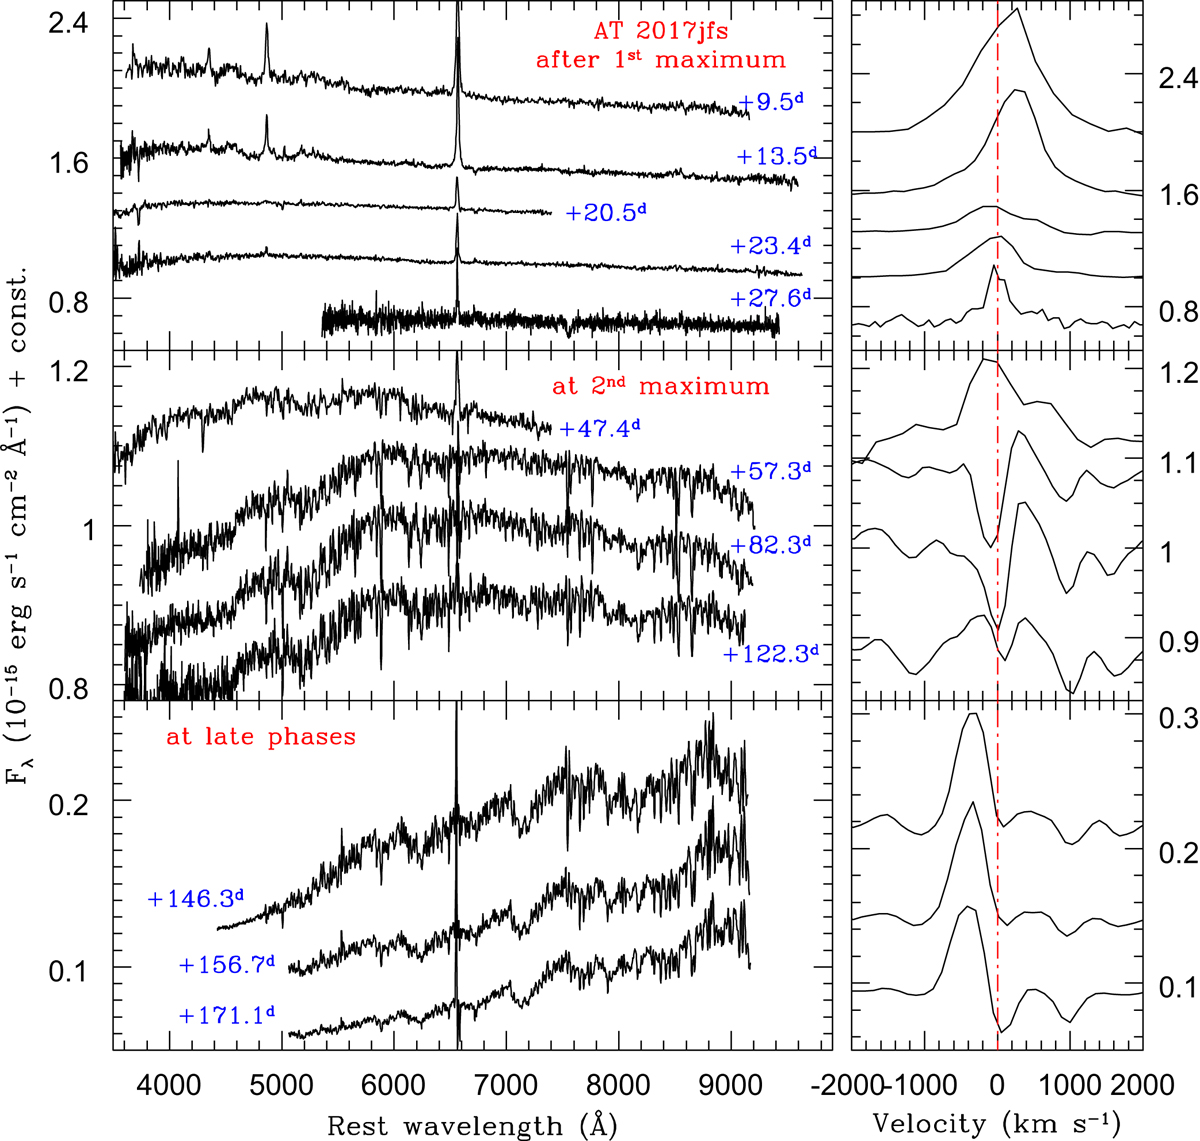
Left: spectral evolution of AT 2017jfs soon after the first blue maximum (top), around the second, red maximum (center), and at late phases (bottom). Right: expanded image of the Hα region in the velocity space. The vertical line marks the rest wavelength position of Hα at the same phases as the left panels (after correcting for the host galaxy redshift z = 0.007809 as reported in NED). Only the highest-S/N spectra are shown. The absorptions visible at velocities 0 and +1000 km s−1 in late spectra can be partly due to an over-subtraction of the unresolved Hα and [N II] λ6583 from the host galaxy background.
Current usage metrics show cumulative count of Article Views (full-text article views including HTML views, PDF and ePub downloads, according to the available data) and Abstracts Views on Vision4Press platform.
Data correspond to usage on the plateform after 2015. The current usage metrics is available 48-96 hours after online publication and is updated daily on week days.
Initial download of the metrics may take a while.