Free Access
Fig. 1.
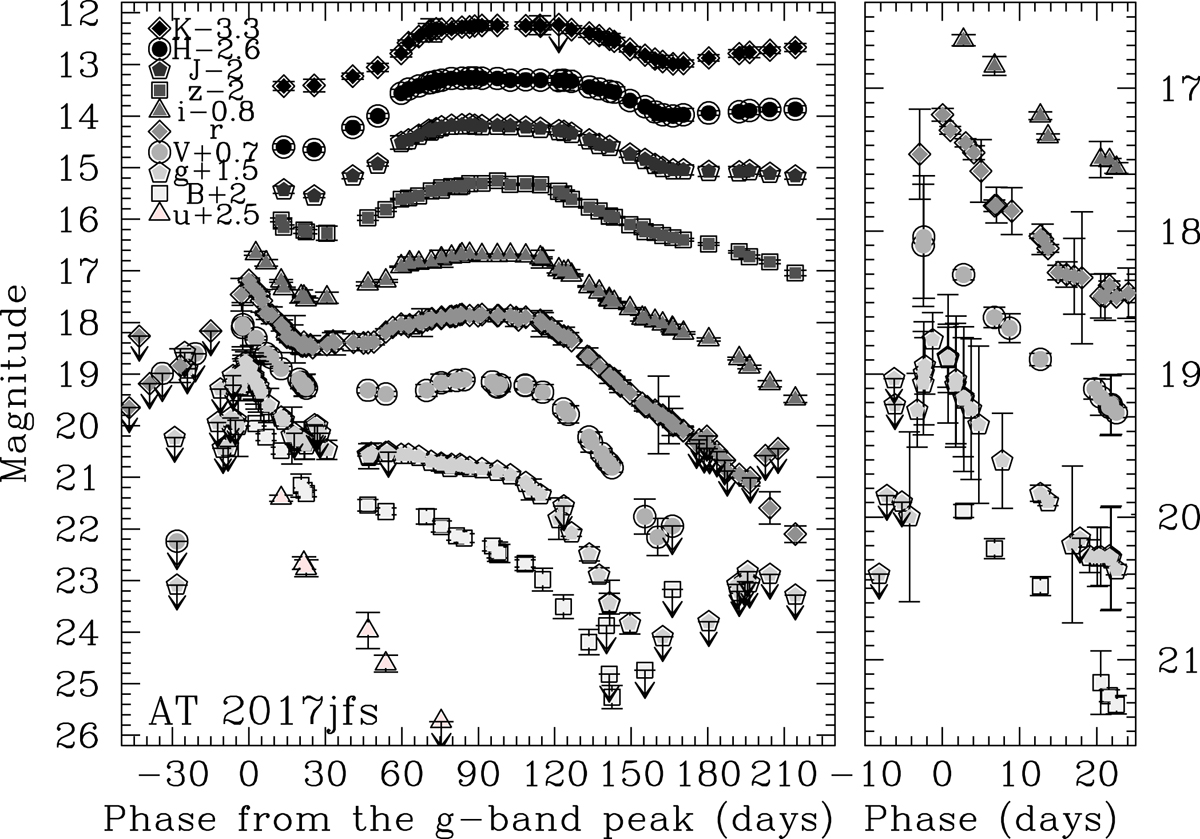
Left: optical and NIR light curves of AT 2017jfs. The phases are calculated from the first g-band peak, on MJD = 58114.8 ± 1.8. Only the most significant detection limits are shown. Right: B, V, g, r and i light curves during the first (blue) peak.
Current usage metrics show cumulative count of Article Views (full-text article views including HTML views, PDF and ePub downloads, according to the available data) and Abstracts Views on Vision4Press platform.
Data correspond to usage on the plateform after 2015. The current usage metrics is available 48-96 hours after online publication and is updated daily on week days.
Initial download of the metrics may take a while.