Free Access
Fig. 14.
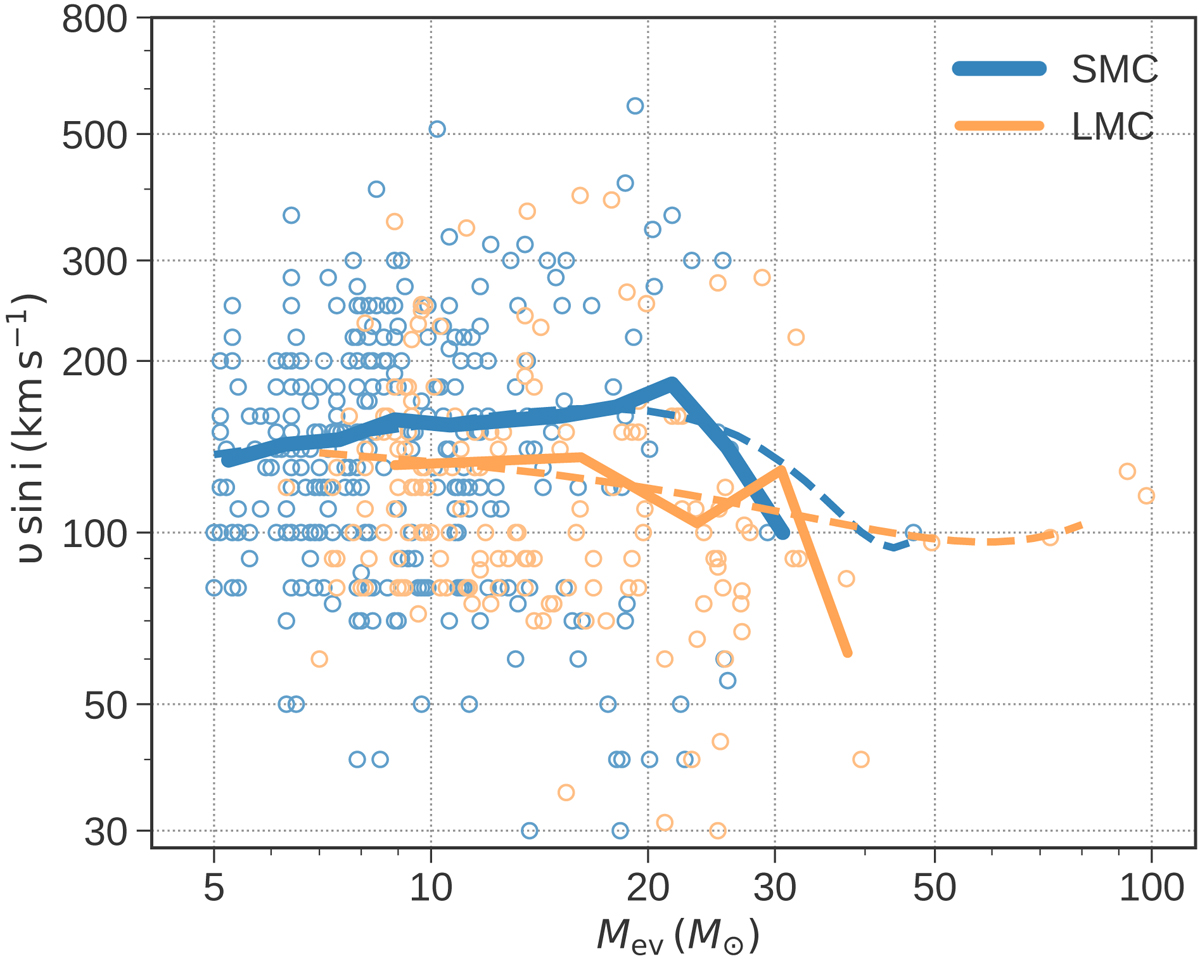
Projected rotational velocities of OB stars as functions of stellar mass (blue circles) on logarithmic scales. The LMC OB star sample (Ramachandran et al. 2018a) is also shown for comparison. Solid lines represent mean velocities averaged over logarithmic mass bins, while dashed lines give nonlinear fits to the data.
Current usage metrics show cumulative count of Article Views (full-text article views including HTML views, PDF and ePub downloads, according to the available data) and Abstracts Views on Vision4Press platform.
Data correspond to usage on the plateform after 2015. The current usage metrics is available 48-96 hours after online publication and is updated daily on week days.
Initial download of the metrics may take a while.