Free Access
Fig. 9
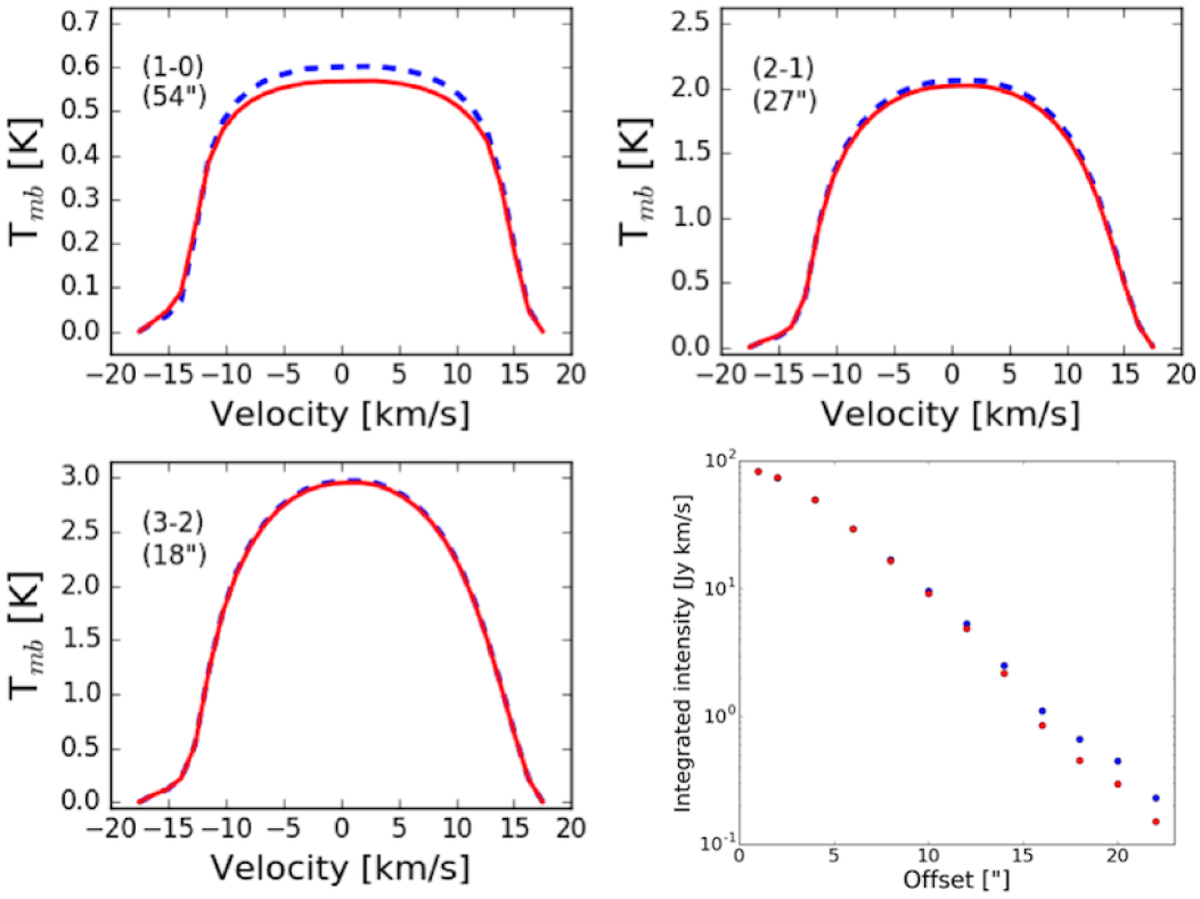
Results of CO RT modelling for model 1 (the reference model) with the CO abundance distribution from this work (red) and MGH88 (blue). The transitions and the beam size are marked in each panel. Bottom right panel: compares the radial distribution of the CO(1–0) integrated intensities at radial offset points.
Current usage metrics show cumulative count of Article Views (full-text article views including HTML views, PDF and ePub downloads, according to the available data) and Abstracts Views on Vision4Press platform.
Data correspond to usage on the plateform after 2015. The current usage metrics is available 48-96 hours after online publication and is updated daily on week days.
Initial download of the metrics may take a while.