Free Access
Fig. 6
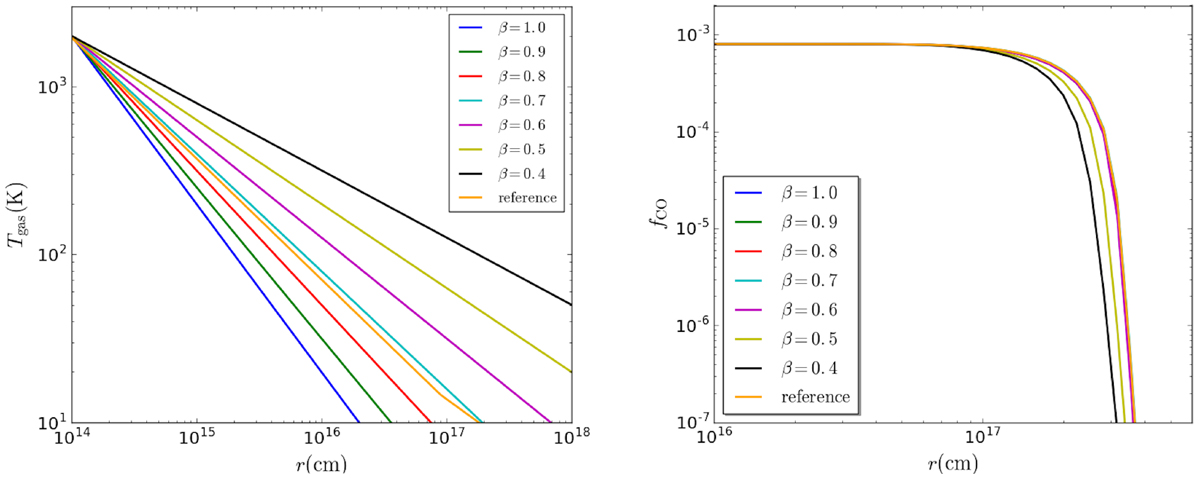
Left panel: tested gas kinetic temperature profiles with different β values. Theprofile with label “reference” corresponds to the temperature of the reference model. Right panel: CO abundance distribution profile derived using the temperature profiles from the left panel.
Current usage metrics show cumulative count of Article Views (full-text article views including HTML views, PDF and ePub downloads, according to the available data) and Abstracts Views on Vision4Press platform.
Data correspond to usage on the plateform after 2015. The current usage metrics is available 48-96 hours after online publication and is updated daily on week days.
Initial download of the metrics may take a while.