Fig. A.3.
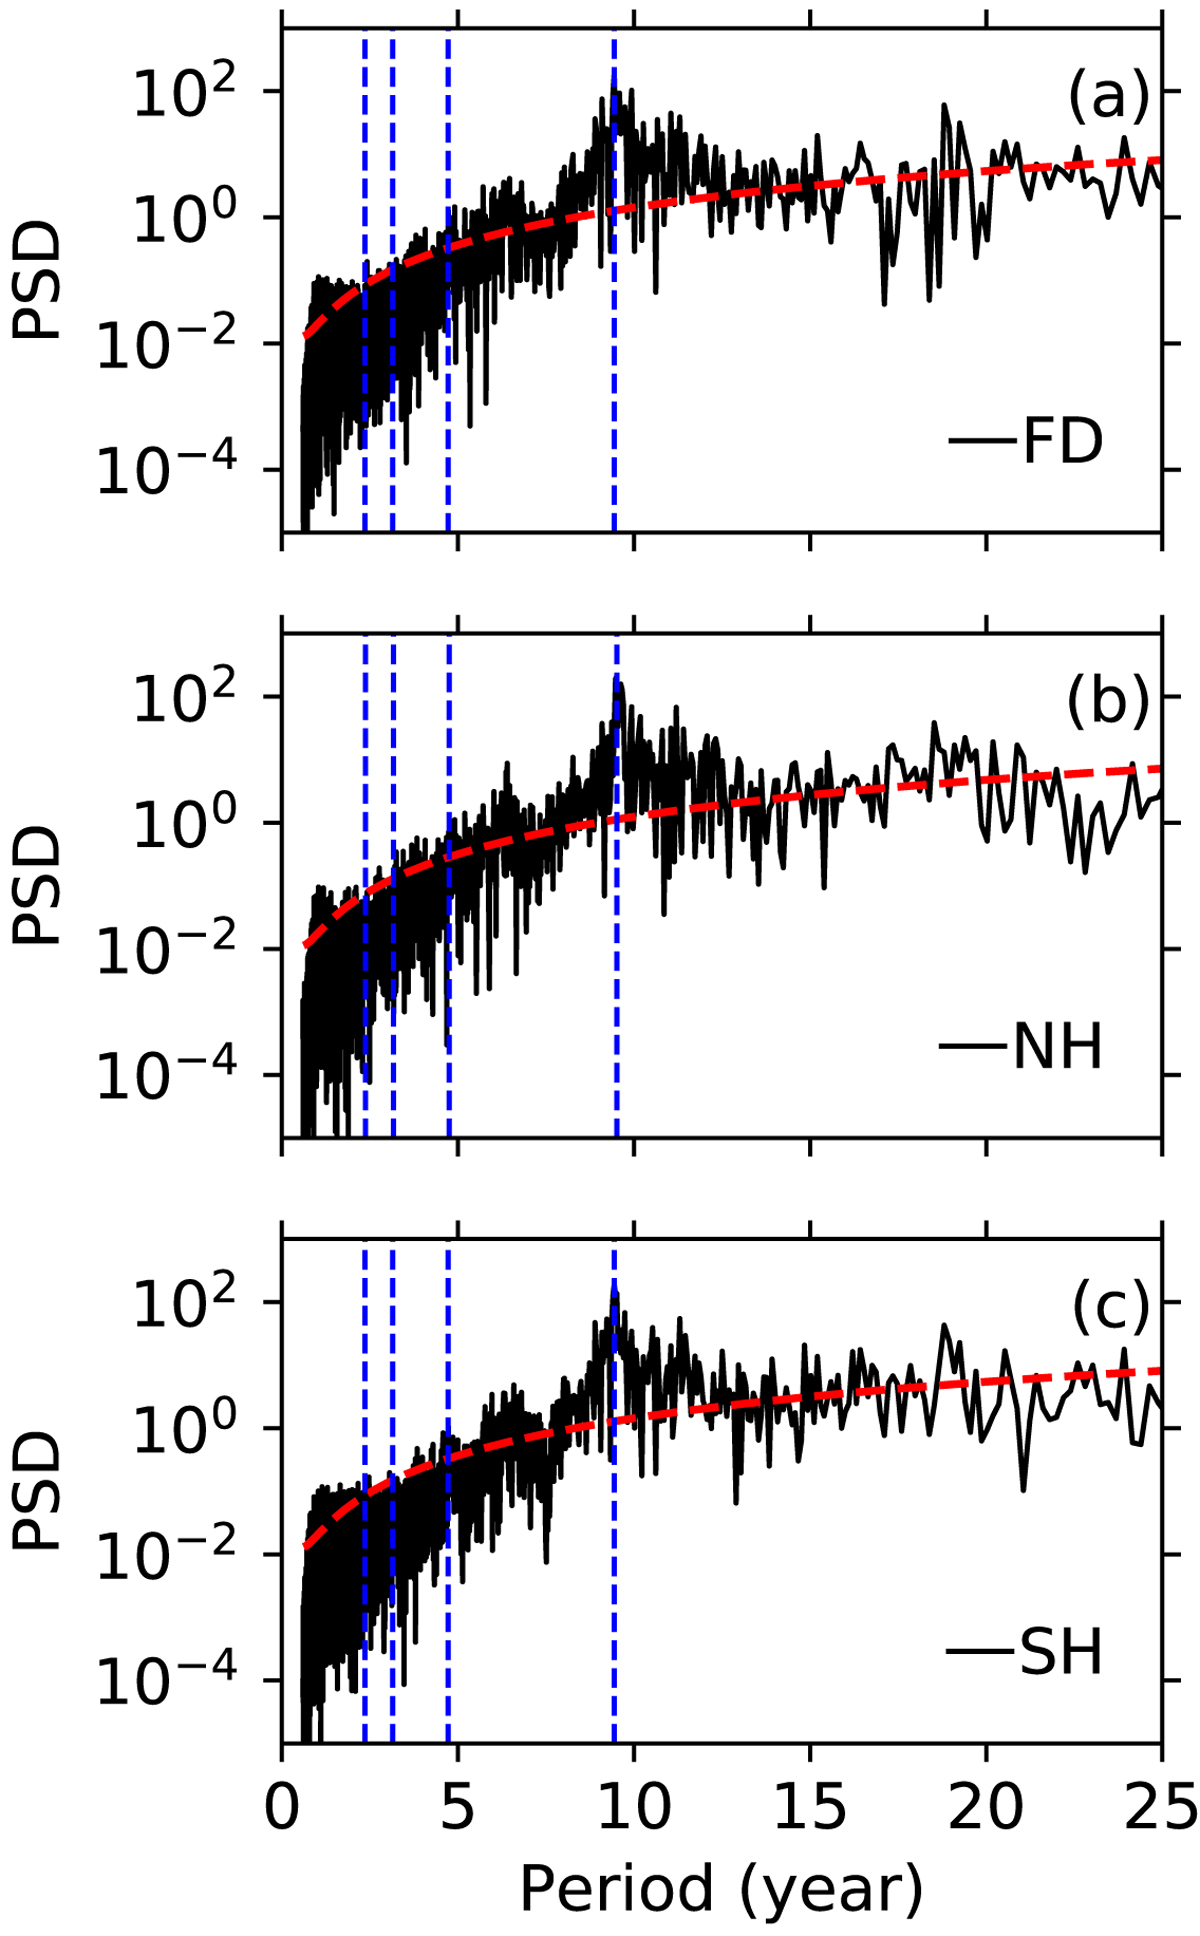
Fourier power spectral densities for the turbulent α-dynamo data (black lines), lag-1 auto-correlation Fourier power spectral densities (dashed-red lines) indicating the significance level of 0.05, and the highest period and its first three harmonics (dashed-blue lines) for full disk (a), northern hemisphere (b), and southern hemisphere (c).
Current usage metrics show cumulative count of Article Views (full-text article views including HTML views, PDF and ePub downloads, according to the available data) and Abstracts Views on Vision4Press platform.
Data correspond to usage on the plateform after 2015. The current usage metrics is available 48-96 hours after online publication and is updated daily on week days.
Initial download of the metrics may take a while.