Fig. 6
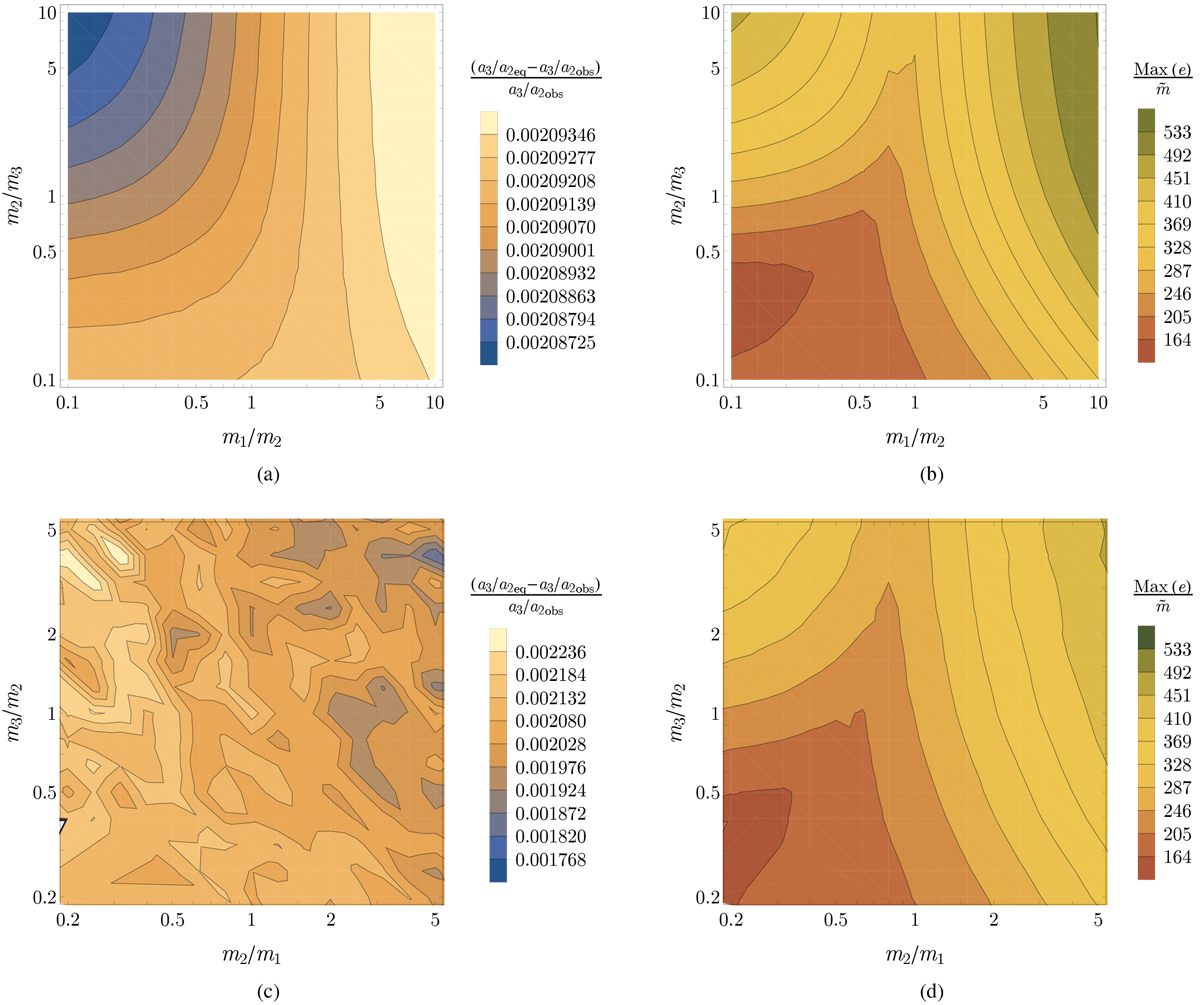
Top row: analytical maps constructed for Kepler-305 as explained in Sect. 3.2. Panel a: we plot the quantity ![]() , which represents how close the system is now to some resonant equilibrium point, for different mass ratios m1 ∕m2 and m2 ∕m3 (each point in this plot is constructed by repeating the procedure described in Fig. 5). We notice that
, which represents how close the system is now to some resonant equilibrium point, for different mass ratios m1 ∕m2 and m2 ∕m3 (each point in this plot is constructed by repeating the procedure described in Fig. 5). We notice that
![]() changes verylittle with the mass ratios, and is of the order of ~0.002. Comparing with Fig. 9, we see that this can be the case by pure chance only in ~ 15% of randomly generated systems close to the 3:2–2:1 mean motion resonance chain. Panel b: we show a map of the quantity
changes verylittle with the mass ratios, and is of the order of ~0.002. Comparing with Fig. 9, we see that this can be the case by pure chance only in ~ 15% of randomly generated systems close to the 3:2–2:1 mean motion resonance chain. Panel b: we show a map of the quantity
![]() representing the equilibrium orbital configuration that is selected at each fixed value of m1 ∕m2 and m2 ∕m3 by imposing (a3∕a1)|eq ≡ (a3∕a1)|obs. Bottom row: numerical maps constructed for Kepler-305 as explained in Sect. 3.3. We show numerical maps of
representing the equilibrium orbital configuration that is selected at each fixed value of m1 ∕m2 and m2 ∕m3 by imposing (a3∕a1)|eq ≡ (a3∕a1)|obs. Bottom row: numerical maps constructed for Kepler-305 as explained in Sect. 3.3. We show numerical maps of ![]() in panel c and
in panel c and ![]() in panel d, analogous to the analytical plots above (over a slightly smaller range of mass ratios for simplicity). These are intended to validate the analytical maps, and show very good agreement between corresponding panels.
in panel d, analogous to the analytical plots above (over a slightly smaller range of mass ratios for simplicity). These are intended to validate the analytical maps, and show very good agreement between corresponding panels.
Current usage metrics show cumulative count of Article Views (full-text article views including HTML views, PDF and ePub downloads, according to the available data) and Abstracts Views on Vision4Press platform.
Data correspond to usage on the plateform after 2015. The current usage metrics is available 48-96 hours after online publication and is updated daily on week days.
Initial download of the metrics may take a while.