Fig. 2
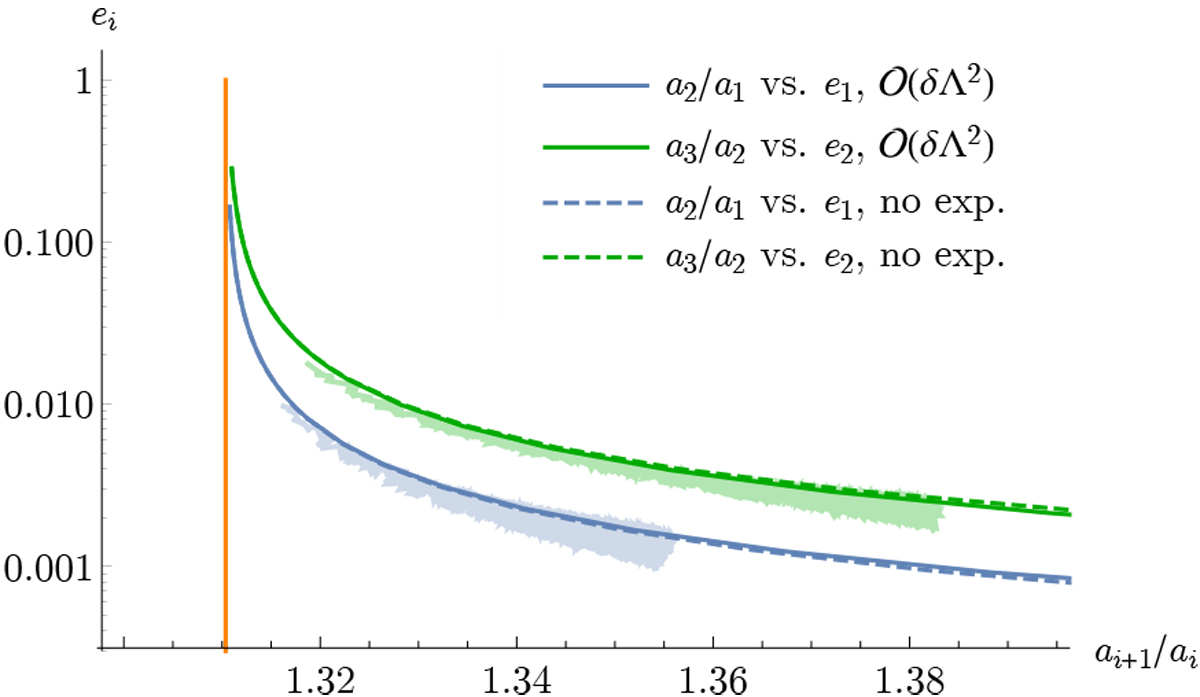
Equilibrium curves showing the loci of the stable resonant equilibrium points calculated as explained in the text, in the case of a 3:2 – 3:2 mean motion resonance chain, with m1 = m2 = m3 = 10−4M*. The full curves are calculated using the expanded Keplerian Hamiltonian (Eq. (11)), while the dashed curves are calculated using the unexpanded Keplerian Hamiltonian (Eq. (6)), showing very little difference down to very small eccentricities and for reasonable values of the nearly exactly resonant semi-major axis ratio. The location of the nominal resonant semi-major axis ratio (3/2)2/3 is shown bya vertical orange line. We also superimpose the numerically computed evolution of a three-planet system deep in the 3:2 mean motion resonance (for both pairs) and undergoing dissipative evolution depicted with transparent lines: the system follows the locations of the equilibrium points, which are close to the curves calculated analytically.
Current usage metrics show cumulative count of Article Views (full-text article views including HTML views, PDF and ePub downloads, according to the available data) and Abstracts Views on Vision4Press platform.
Data correspond to usage on the plateform after 2015. The current usage metrics is available 48-96 hours after online publication and is updated daily on week days.
Initial download of the metrics may take a while.