Fig. 5.
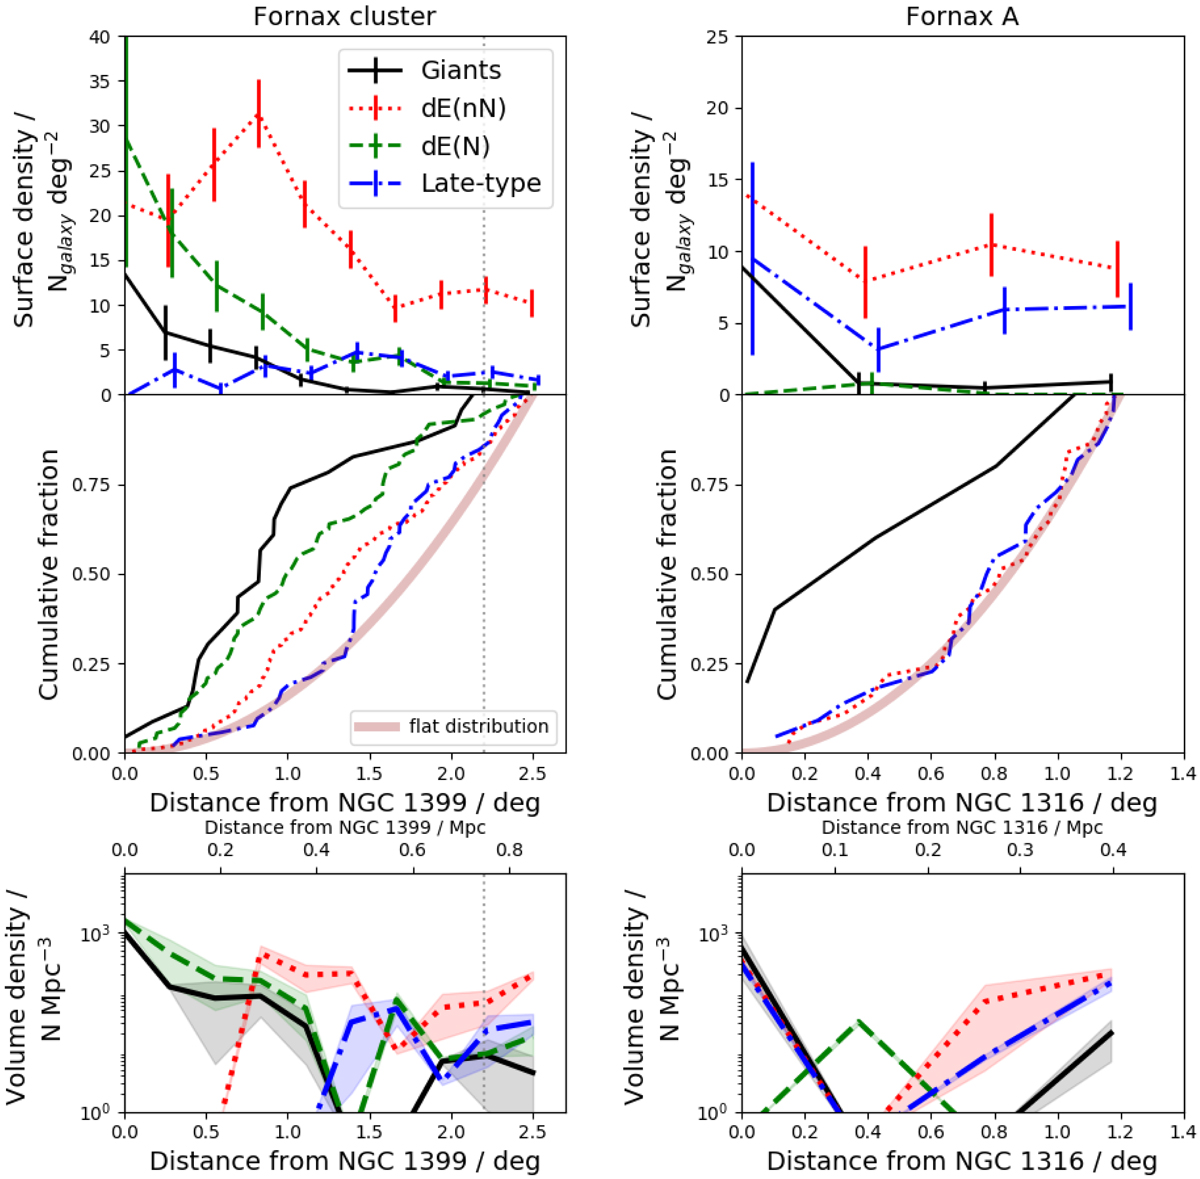
Upper panels: surface number density of the galaxies as a function of the cluster-centric radius (left panels) and the distance from Fornax-A (right panels). Mid panels: corresponding cumulative number fractions as function of radii. The black solid lines corresponds to the giant galaxies with ![]() , the green dashed and red dotted lines correspond to dE(N)s and dE(nN)s, respectively, and the blue dash-dotted lines corresponds to the late-type dwarfs. For a reference, the purple opaque lines show the cumulative profile for a uniform radial surface density distribution without any cluster-centric concentration. Bottom panels: deprojected volume densities of the galaxies obtained from the radial surface density profiles using the onion peeling technique described in the Appendix B. The shaded areas correspond to the uncertainties in the deprojected profiles, estimated with Monte Carlo method. The vertical gray dotted lines in the left panels correspond to the virial radius of the cluster.
, the green dashed and red dotted lines correspond to dE(N)s and dE(nN)s, respectively, and the blue dash-dotted lines corresponds to the late-type dwarfs. For a reference, the purple opaque lines show the cumulative profile for a uniform radial surface density distribution without any cluster-centric concentration. Bottom panels: deprojected volume densities of the galaxies obtained from the radial surface density profiles using the onion peeling technique described in the Appendix B. The shaded areas correspond to the uncertainties in the deprojected profiles, estimated with Monte Carlo method. The vertical gray dotted lines in the left panels correspond to the virial radius of the cluster.
Current usage metrics show cumulative count of Article Views (full-text article views including HTML views, PDF and ePub downloads, according to the available data) and Abstracts Views on Vision4Press platform.
Data correspond to usage on the plateform after 2015. The current usage metrics is available 48-96 hours after online publication and is updated daily on week days.
Initial download of the metrics may take a while.