Fig. 3.
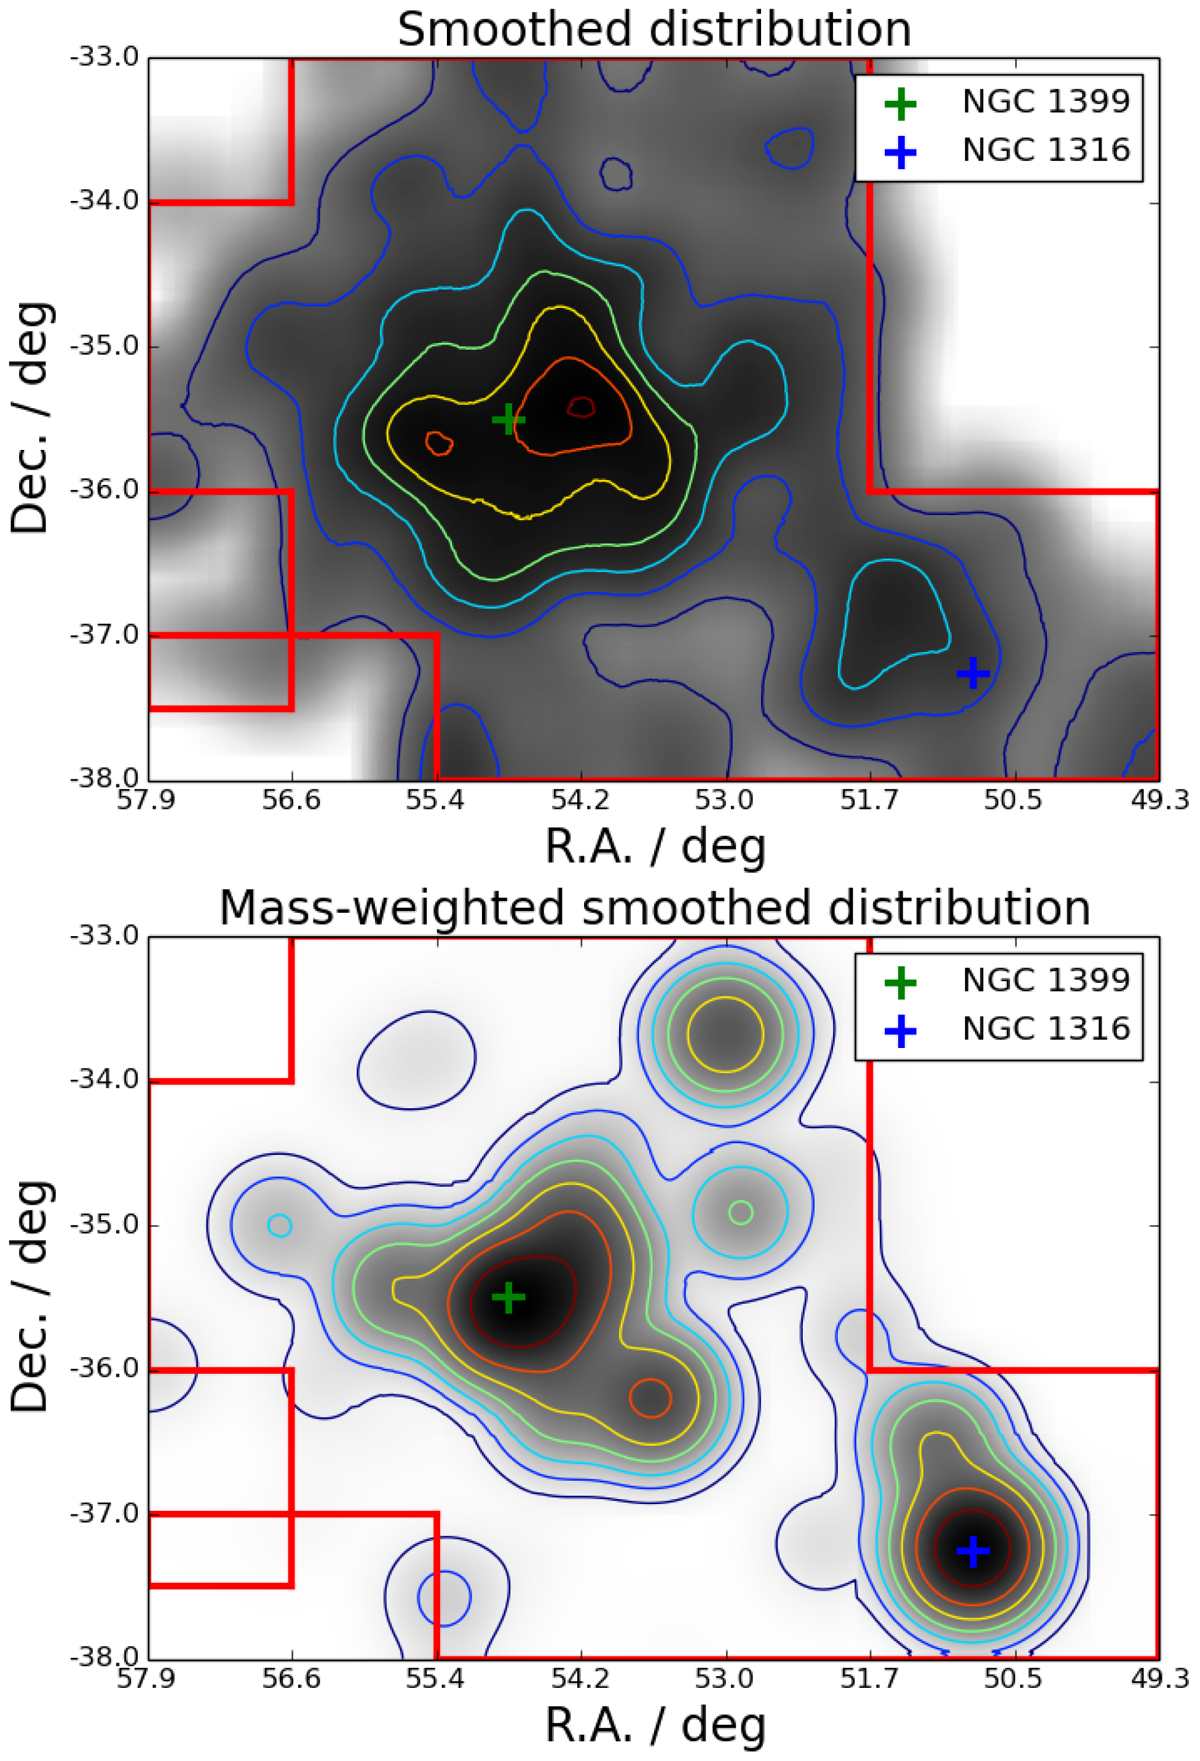
Smoothed distributions of the galaxies in the Fornax cluster. Upper panel: surface number density distribution of galaxies using a Gaussian convolution kernel with σ = 15 arcmin. Lower panel: smoothed surface mass density distribution using the same kernel. The colored contours in the upper and lower panels highlight the iso-density curves with linear and logarithmic spacing, respectively. The green and blue crosses show the locations of NGC 1399 and NGC 1316, respectively. The red lines frame the area covered by the FDS. In the figures north is up and east is toward left.
Current usage metrics show cumulative count of Article Views (full-text article views including HTML views, PDF and ePub downloads, according to the available data) and Abstracts Views on Vision4Press platform.
Data correspond to usage on the plateform after 2015. The current usage metrics is available 48-96 hours after online publication and is updated daily on week days.
Initial download of the metrics may take a while.