Fig. B.1.
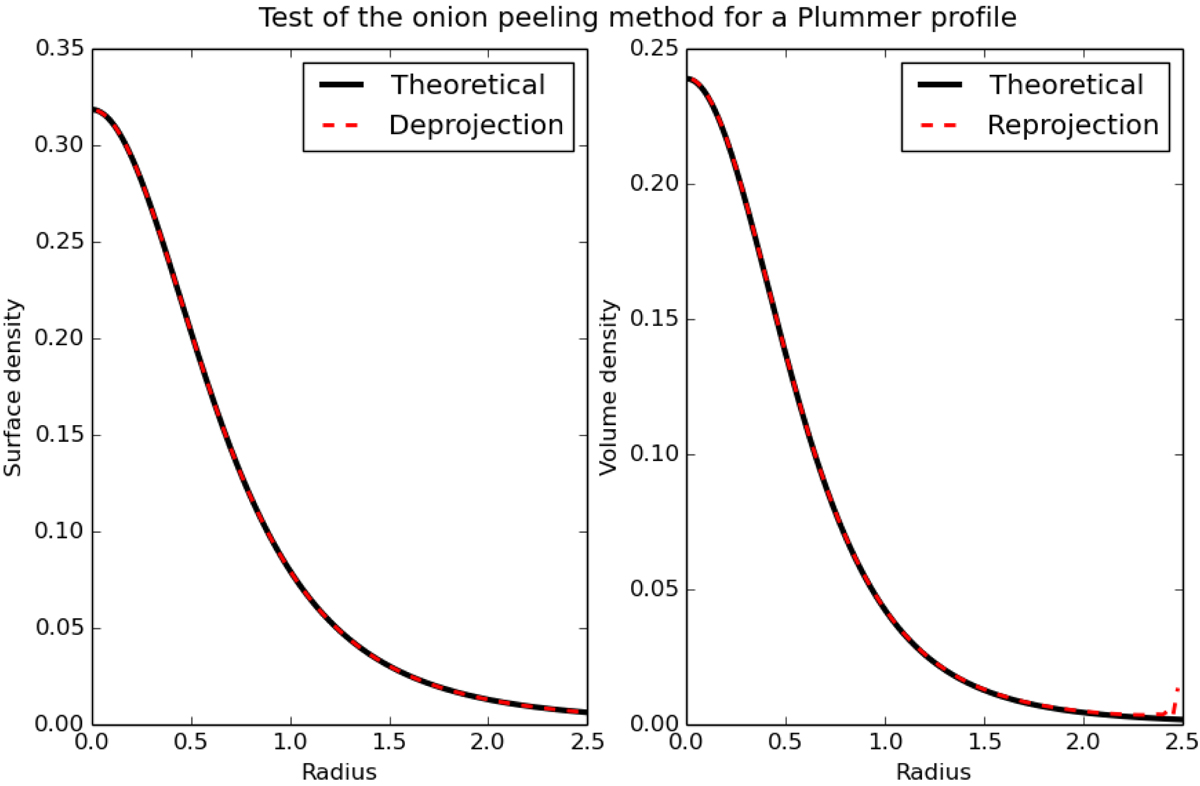
Test of the onion peeling method for a Plummer sphere. The black line in the left panel shows the analytically calculated surface density for a Plummer sphere as a function of radius. The black line in the right panel show the corresponding analytical volume density. The red dashed lines in the right and left panels show the deprojected volume and surface density, respectively, obtained from the analytical surface density profile using the onion peeling method.
Current usage metrics show cumulative count of Article Views (full-text article views including HTML views, PDF and ePub downloads, according to the available data) and Abstracts Views on Vision4Press platform.
Data correspond to usage on the plateform after 2015. The current usage metrics is available 48-96 hours after online publication and is updated daily on week days.
Initial download of the metrics may take a while.