Fig. 2.
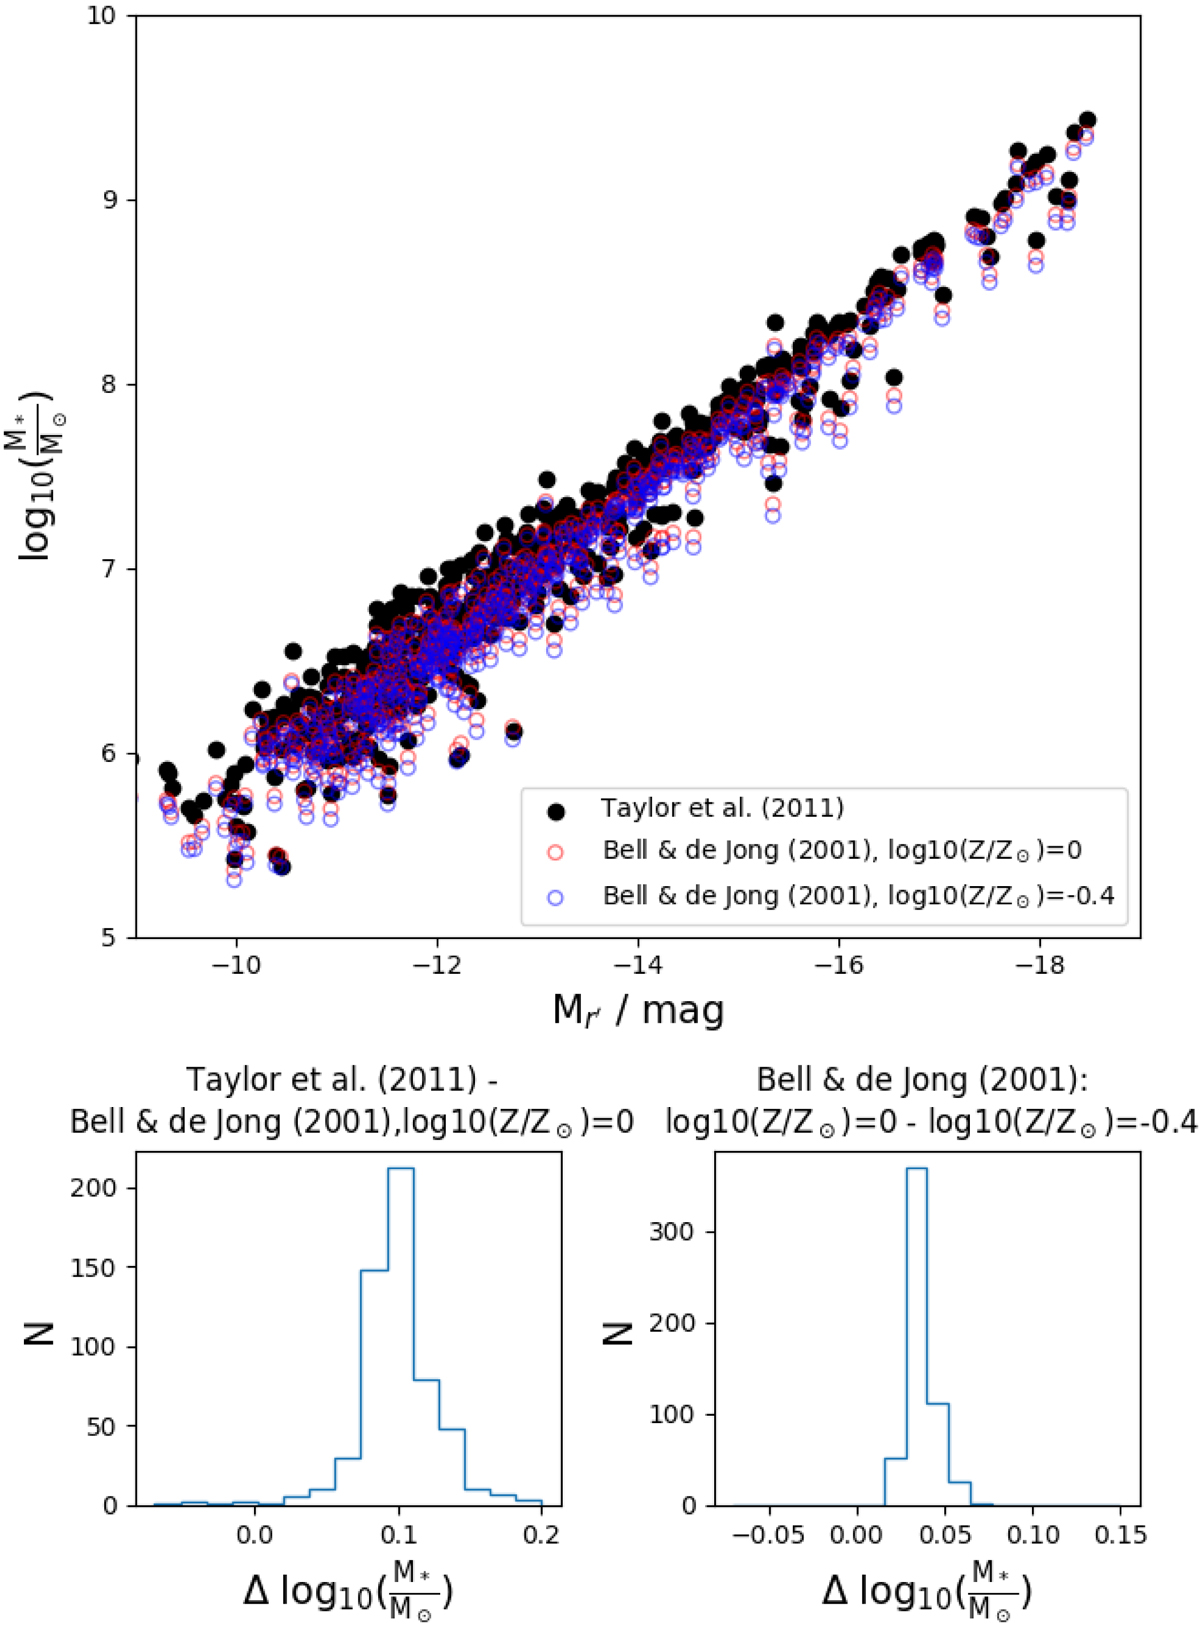
Upper panel: stellar masses of the galaxies as a function of their r′-band absolute magnitude (Mr′). The black symbols show the transformations when using the relations of Taylor et al. (2011) and the red and blue symbols show the relations when using Bell & de Jong (2001) transformations with the assumed metallicities of 0 and −0.4, respectively. Lower left panel: histogram of the differences between stellar masses obtained using the formulae of Taylor et al. (2011) and Bell & de Jong (2001). Lower right panel: differences in stellar masses when using the models of Bell and de Jong, but assuming two different metallicities.
Current usage metrics show cumulative count of Article Views (full-text article views including HTML views, PDF and ePub downloads, according to the available data) and Abstracts Views on Vision4Press platform.
Data correspond to usage on the plateform after 2015. The current usage metrics is available 48-96 hours after online publication and is updated daily on week days.
Initial download of the metrics may take a while.