Fig. 18.
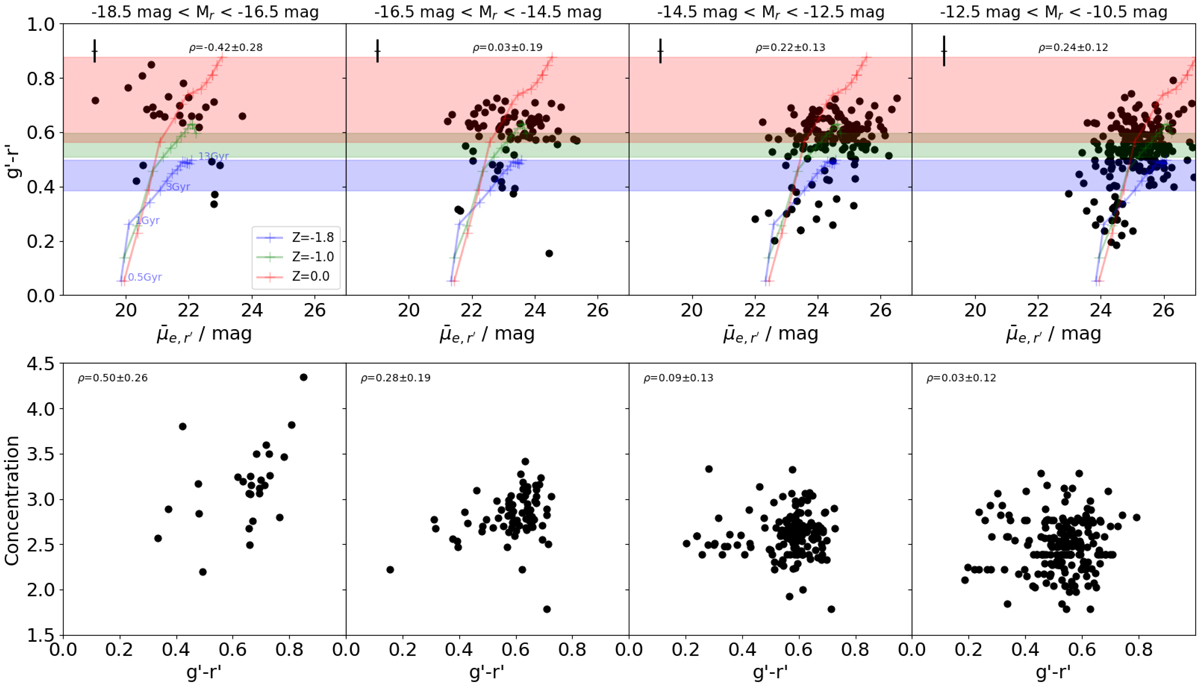
Upper and lower panels: g′ − r′ color and the concentration parameter C of the galaxies as a function of their mean effective surface brightness in the r′-band ( ![]() ), respectively. The different columns show the relations for different luminosity ranges. The lines show the evolutionary track of single stellar population for a Kroupa-like IMF with metallicities of log10(Z/Z⊙) = 0.0, −1.0 and −1.8 from 0.5 Gyr to 13 Gyr (the colored dots on the lines correspond to 0.5, 1, 2, 3, 4,..., 13 Gyr). We have also shaded the color ranges corresponding the stellar population ages between 3 and 13 Gyr with the colors matching the corresponding evolutionary tracks. The ρ-values reported in the upper part of the panels correspond to the Spearman’s correlation coefficient and it’s uncertainty calculated for the point in the corresponding panel.
), respectively. The different columns show the relations for different luminosity ranges. The lines show the evolutionary track of single stellar population for a Kroupa-like IMF with metallicities of log10(Z/Z⊙) = 0.0, −1.0 and −1.8 from 0.5 Gyr to 13 Gyr (the colored dots on the lines correspond to 0.5, 1, 2, 3, 4,..., 13 Gyr). We have also shaded the color ranges corresponding the stellar population ages between 3 and 13 Gyr with the colors matching the corresponding evolutionary tracks. The ρ-values reported in the upper part of the panels correspond to the Spearman’s correlation coefficient and it’s uncertainty calculated for the point in the corresponding panel.
Current usage metrics show cumulative count of Article Views (full-text article views including HTML views, PDF and ePub downloads, according to the available data) and Abstracts Views on Vision4Press platform.
Data correspond to usage on the plateform after 2015. The current usage metrics is available 48-96 hours after online publication and is updated daily on week days.
Initial download of the metrics may take a while.