Fig. 14.
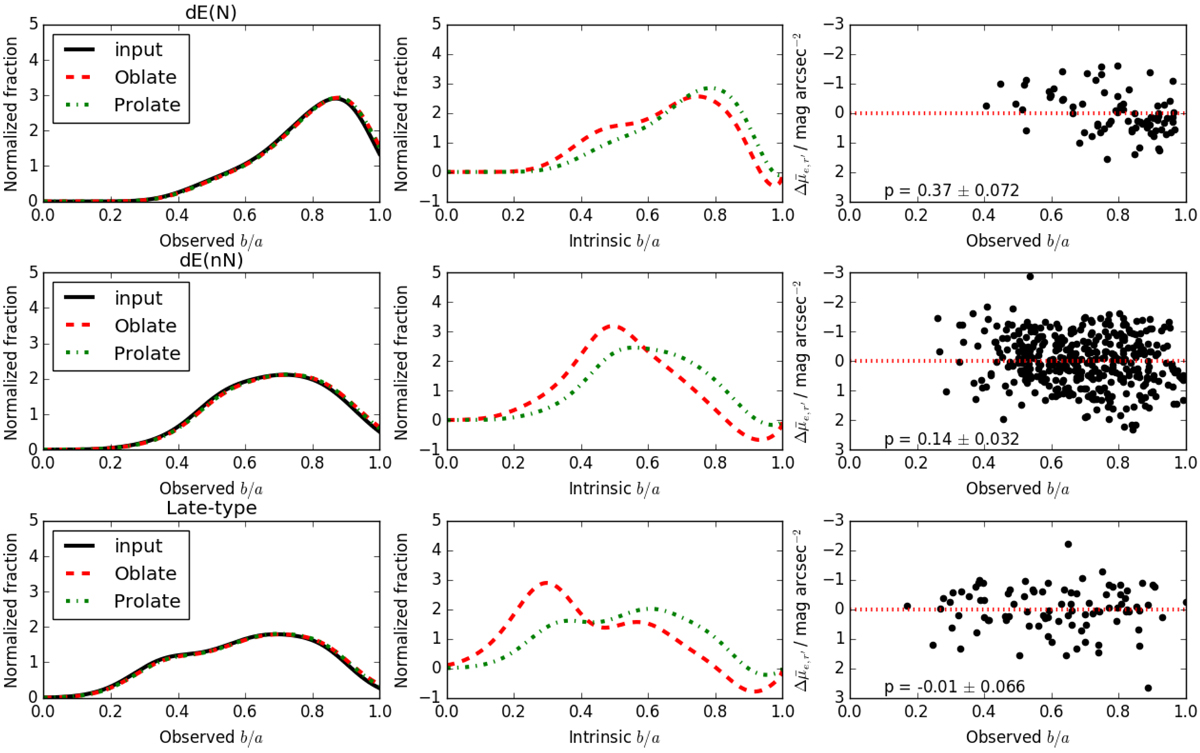
Intrinsic shape distributions deduced from the observed b/a distributions. Left panels: observed b/a distribution with the black lines, and the reprojected b/a distributions obtained from the modeled intrinsic shape distributions with the red dashed and the green dash-dotted lines for an oblate and prolate models, respectively. Middle panels: intrinsic minor-to-major axis (q) distributions obtained via modeling for the oblate and prolate models. Right panels: relation of the difference from the magnitude–surface brightness relation with the observed axis ratio. The Spearman’s rank correlation coefficient p and its uncertainty are reported in each scatter plot. Rows from top to bottom: analysis for dE(N), dE(nN) and late-type dwarfs, respectively.
Current usage metrics show cumulative count of Article Views (full-text article views including HTML views, PDF and ePub downloads, according to the available data) and Abstracts Views on Vision4Press platform.
Data correspond to usage on the plateform after 2015. The current usage metrics is available 48-96 hours after online publication and is updated daily on week days.
Initial download of the metrics may take a while.