Fig. 13.
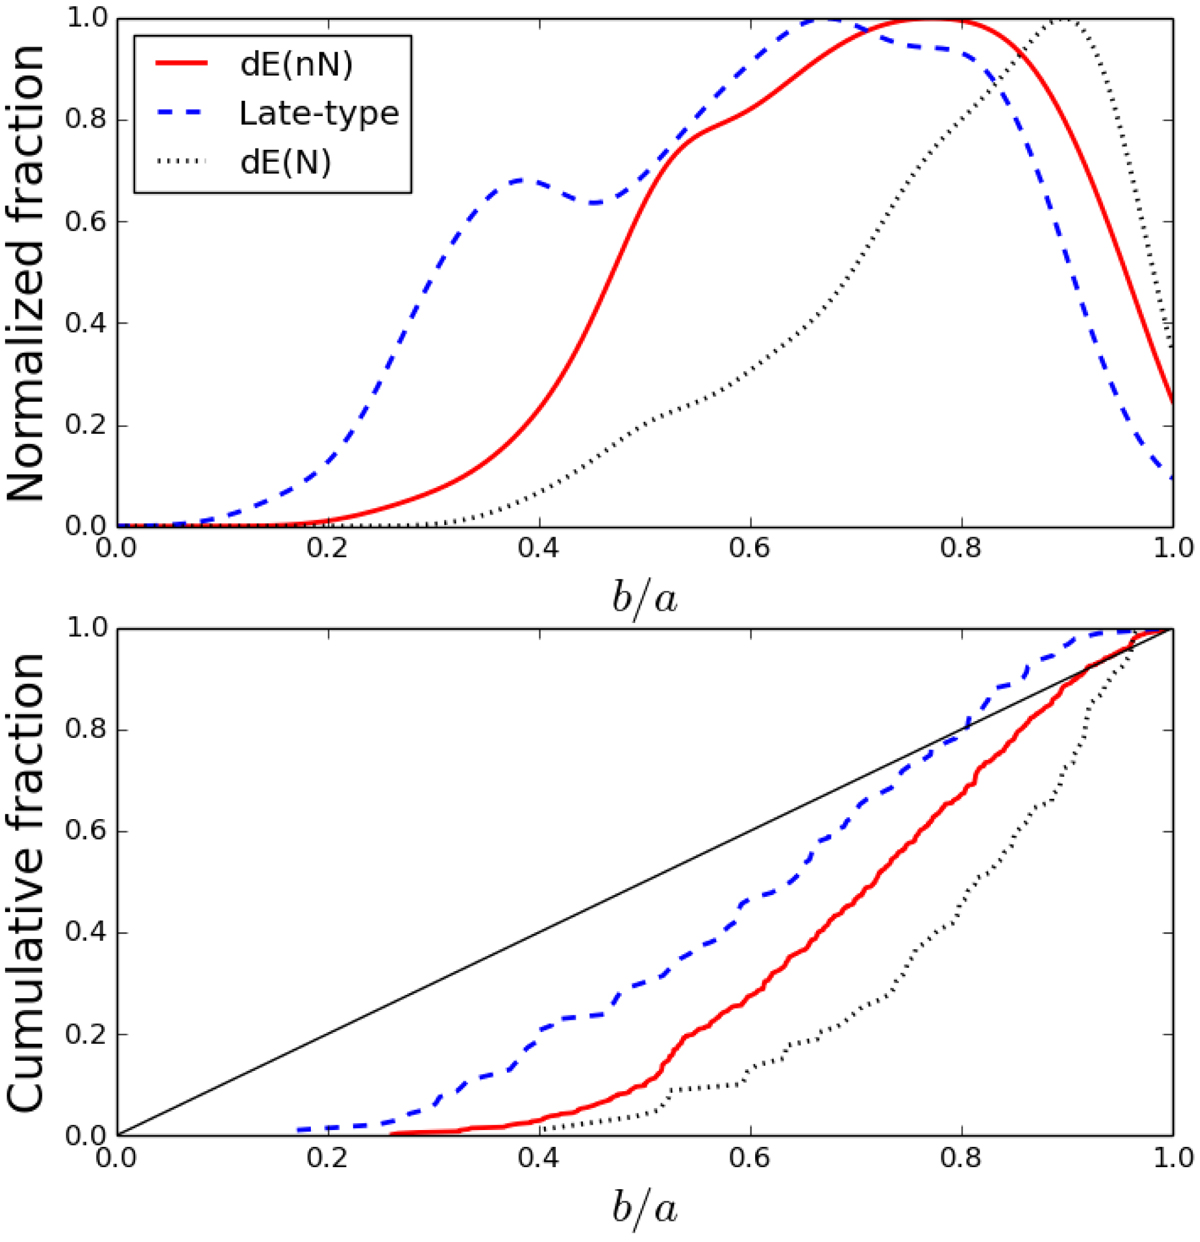
Axis ratio distributions of the dE(nN)s, dE(N)s, and late-type dwarfs are shown with the red, black and blue histograms, respectively. Upper panel: normalized distributions and lower panel: cumulative ones. The diagonal line in the lower panel represents a flat b/a distribution.
Current usage metrics show cumulative count of Article Views (full-text article views including HTML views, PDF and ePub downloads, according to the available data) and Abstracts Views on Vision4Press platform.
Data correspond to usage on the plateform after 2015. The current usage metrics is available 48-96 hours after online publication and is updated daily on week days.
Initial download of the metrics may take a while.