Fig. 1.
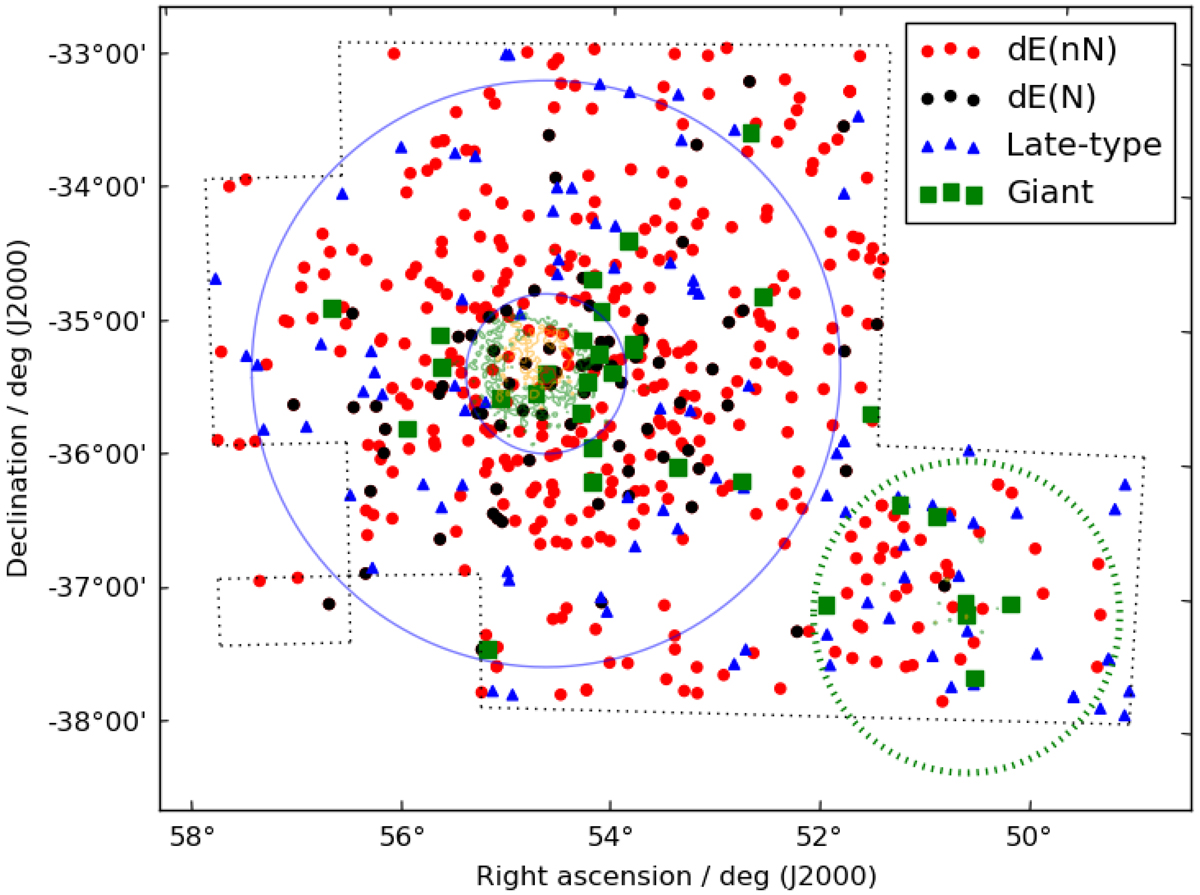
Locations of the likely cluster galaxies in the FDSDC (Venhola et al. 2018). The red, black and blue symbols correspond to non-nucleated dwarf ellipticals, dE(nN), nucleated dwarf ellipticals, dE(N) and late-type dwarfs, respectively. The black dotted lines show the extent of the FDS observations. The inner and outer blue circles show the core (Ferguson 1989) and virial radius (Drinkwater et al. 2001) of the Fornax main cluster respectively, and the green dotted circle encloses an area within one degree from the Fornax A subgroup (Drinkwater et al. 2001). The green, yellow, and red contours around the center of the cluster and Fornax A correspond to the 0.96, 1.15, and 1.34 × 10⁻³ counts arcmin−2 s−1 isophotes of the ROSAT X-ray observations, respectively (Kim et al. 1998; Paolillo et al. 2002). In the figure north is up and east is toward left.
Current usage metrics show cumulative count of Article Views (full-text article views including HTML views, PDF and ePub downloads, according to the available data) and Abstracts Views on Vision4Press platform.
Data correspond to usage on the plateform after 2015. The current usage metrics is available 48-96 hours after online publication and is updated daily on week days.
Initial download of the metrics may take a while.