Fig. 8
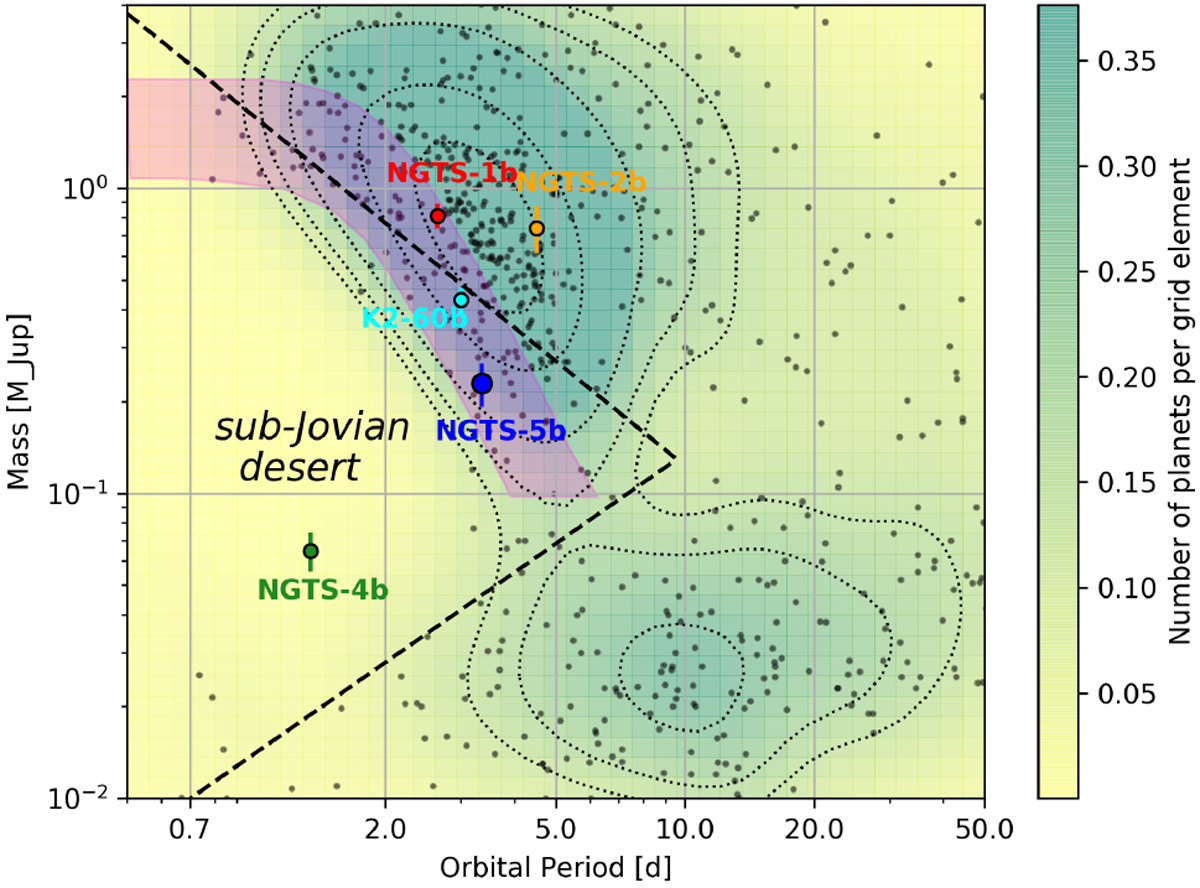
Planetary mass over orbital period. Plotted are all stars from the NASA Exoplanet Archive with a radius uncertainty lower than 10% or a mass uncertainty lower than 50%. The blue point shows NGTS-5b. Additionally, we highlight NGTS-1b in red (Bayliss et al. 2018), NGTS-2b in orange (Raynard et al. 2018), NGTS-4b in green (West et al. 2019), and K2-60b in cyan (Eigmüller et al. 2017). The black dashed lines show the boundaries of the sub-Jovian desert as determined in Mazeh et al. (2016). The magenta region shows the high-eccentricity migration boundary including tidal decay as presented in Owen & Lai (2018). The backgroundand the dotted black lines highlight the point density per grid element (the plot is divided into 40 × 40 equally spaced grid elements) of our sample. The yellow region on the left shows the sub-Jovian desert.
Current usage metrics show cumulative count of Article Views (full-text article views including HTML views, PDF and ePub downloads, according to the available data) and Abstracts Views on Vision4Press platform.
Data correspond to usage on the plateform after 2015. The current usage metrics is available 48-96 hours after online publication and is updated daily on week days.
Initial download of the metrics may take a while.