Fig. 4
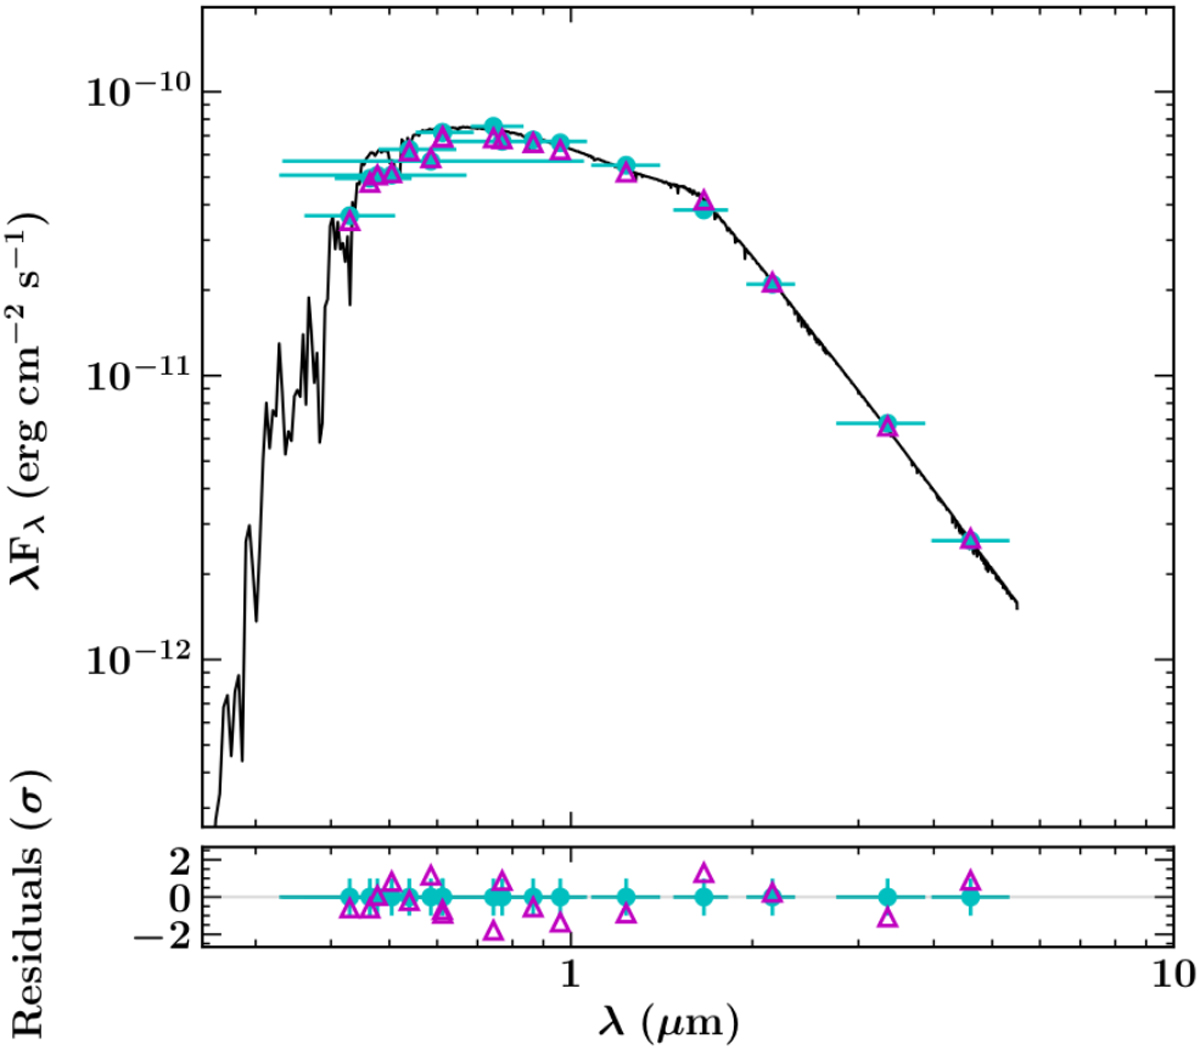
Best-fitting PHOENIX model SED (black line) for NGTS-5 based on the photometric data (cyan points) presented in Table 2. The horizontal cyan lines indicate the widths of the different photometric bands. The magenta triangles represent the model flux convolved with each bandpass. Bottom: residuals of the fit in units of observational uncertainty.
Current usage metrics show cumulative count of Article Views (full-text article views including HTML views, PDF and ePub downloads, according to the available data) and Abstracts Views on Vision4Press platform.
Data correspond to usage on the plateform after 2015. The current usage metrics is available 48-96 hours after online publication and is updated daily on week days.
Initial download of the metrics may take a while.