Fig. 2
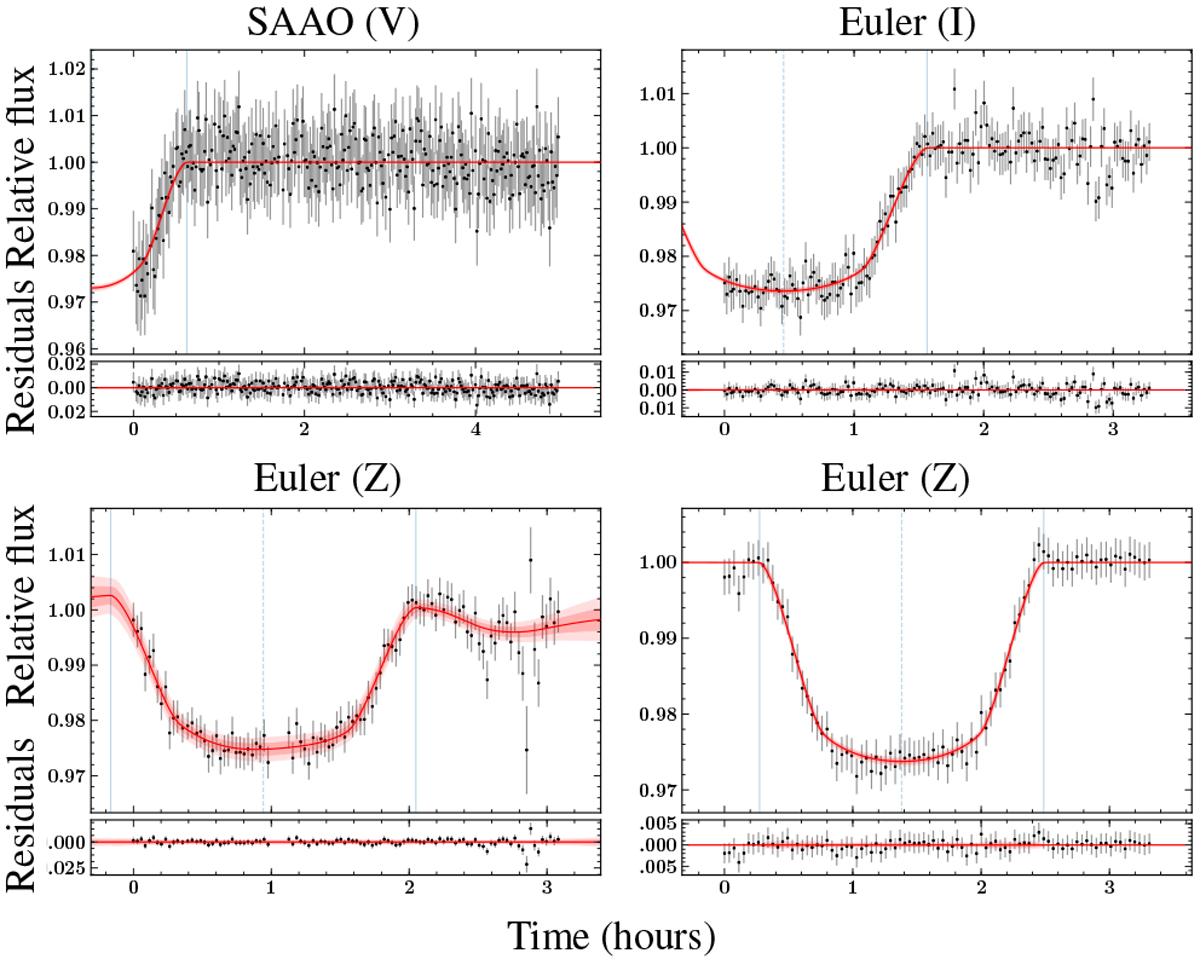
Photometric follow-up light curves from SAAO (Sect. 2.2.1) taken in the night 2017 March 31 (top left) and Euler (Sect. 2.2.2). The Euler light curves were taken in the night 2017 July 13 (top right), 2017 July 23 (bottom left), and 2018 March 8 (bottom right). The red curve and the pink shaded regions show the best model fit and the 1 and 2 σ confidence intervals (same as described for Fig. 1).
Current usage metrics show cumulative count of Article Views (full-text article views including HTML views, PDF and ePub downloads, according to the available data) and Abstracts Views on Vision4Press platform.
Data correspond to usage on the plateform after 2015. The current usage metrics is available 48-96 hours after online publication and is updated daily on week days.
Initial download of the metrics may take a while.