Fig. 1.
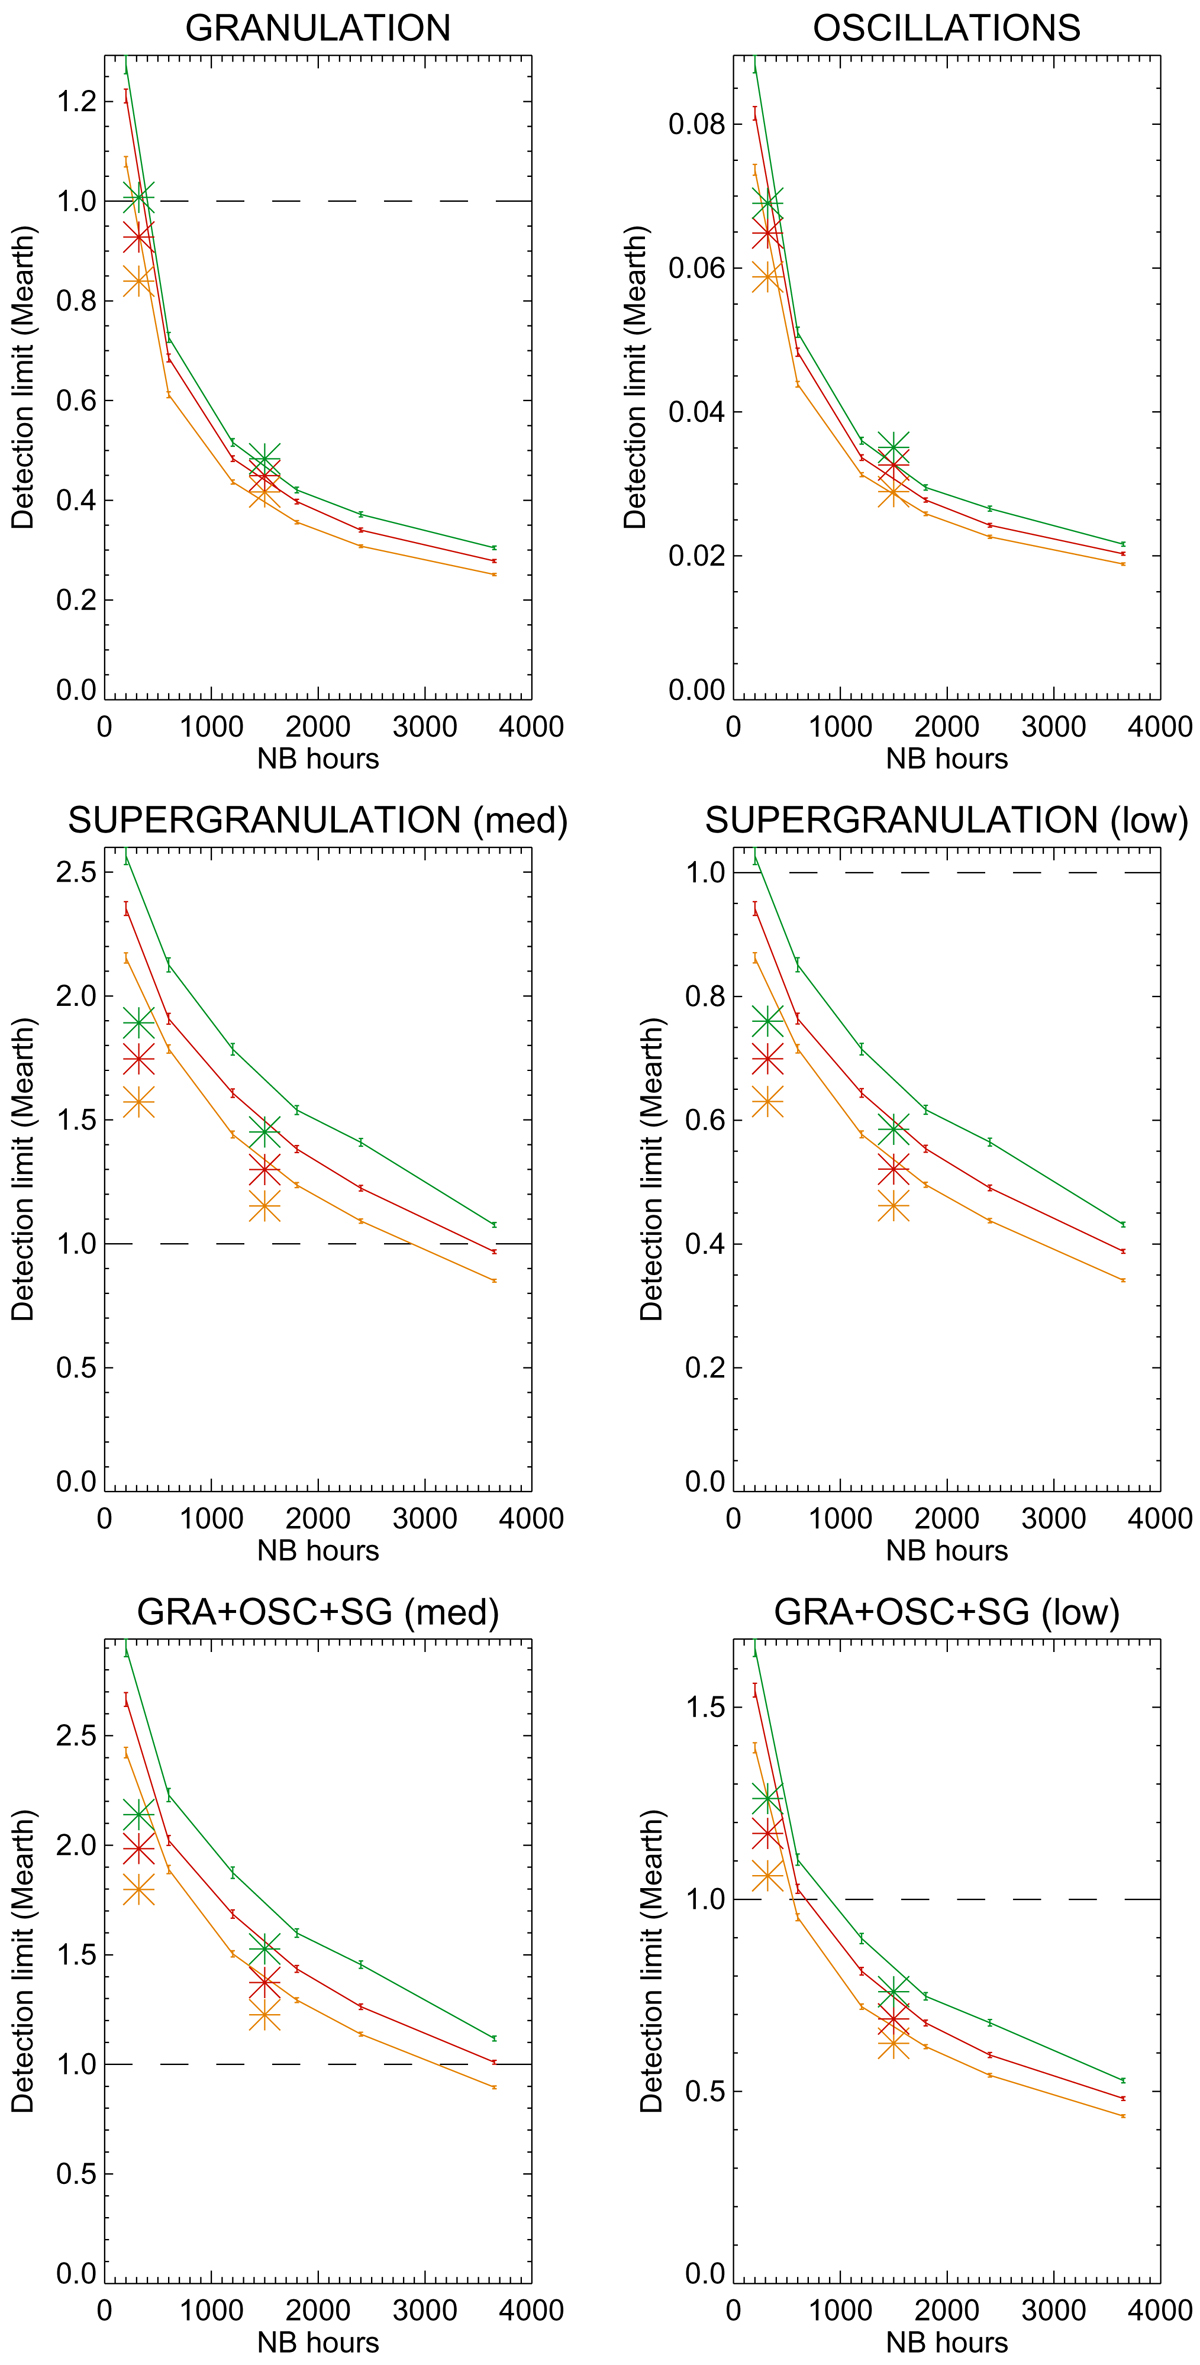
Upper left panel: average LPA detection limit (averaged in phase and signal realizations, in MEarth) vs. the number of hours for the inner side of the habitable zone (275d, orange), the middle (505d, red), and the far side (777d, green). The stars correspond to the additional samplings at 320 and 1500 points (same color code). Here the planet signal is not superposed on the oscillation, granulation, and supergranulation signal (see text). Upper right panel: same for the oscillation signal alone. Middle left panel: same for the supergranulation signal (medium level) alone. Middle right panel: same for the supergranulation signal (low level) alone. Lower left panel: same for the contribution of the three signals (medium level for supergranulation). Lower right panel: same for the contribution of the three signals (low level for supergranulation).
Current usage metrics show cumulative count of Article Views (full-text article views including HTML views, PDF and ePub downloads, according to the available data) and Abstracts Views on Vision4Press platform.
Data correspond to usage on the plateform after 2015. The current usage metrics is available 48-96 hours after online publication and is updated daily on week days.
Initial download of the metrics may take a while.