Fig. 5.
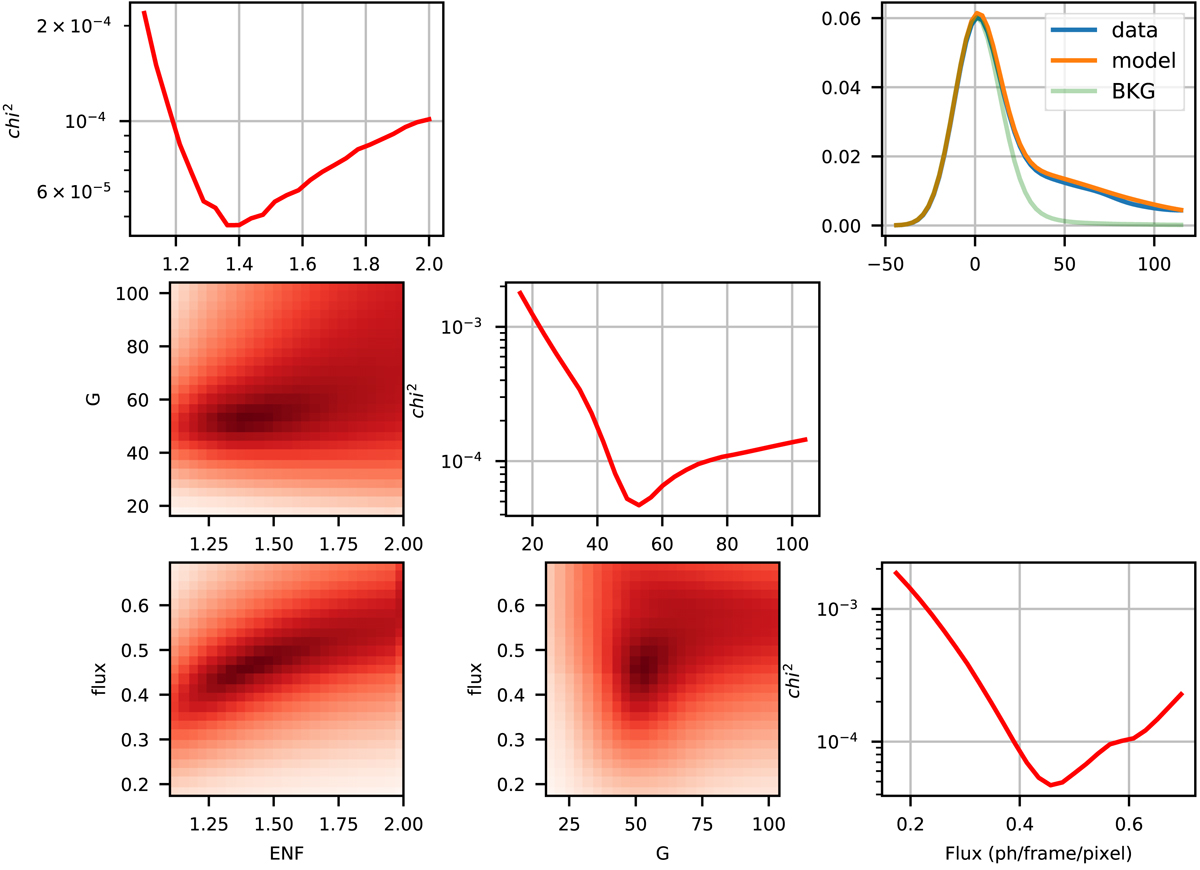
Example of ![]() minimization result. This example is from data with Gman = 76.7, the expected gain from the manufacturer calibration. The parameters that minimize the
minimization result. This example is from data with Gman = 76.7, the expected gain from the manufacturer calibration. The parameters that minimize the ![]() are F = 0.46, G = 52.2, and ENF = 1.38. Diagonal: minimum
are F = 0.46, G = 52.2, and ENF = 1.38. Diagonal: minimum ![]() as a function of ENF (top left), G (middle), and F (bottom right), the two other parameters being free. Lower left: maps of minimum
as a function of ENF (top left), G (middle), and F (bottom right), the two other parameters being free. Lower left: maps of minimum ![]() . Upper right: histogram for the data with illumination in blue, histogram of the background in light green, and histogram obtained with the parameters that minimize the
. Upper right: histogram for the data with illumination in blue, histogram of the background in light green, and histogram obtained with the parameters that minimize the ![]() in orange.
in orange.
Current usage metrics show cumulative count of Article Views (full-text article views including HTML views, PDF and ePub downloads, according to the available data) and Abstracts Views on Vision4Press platform.
Data correspond to usage on the plateform after 2015. The current usage metrics is available 48-96 hours after online publication and is updated daily on week days.
Initial download of the metrics may take a while.