Open Access
Fig. 2.
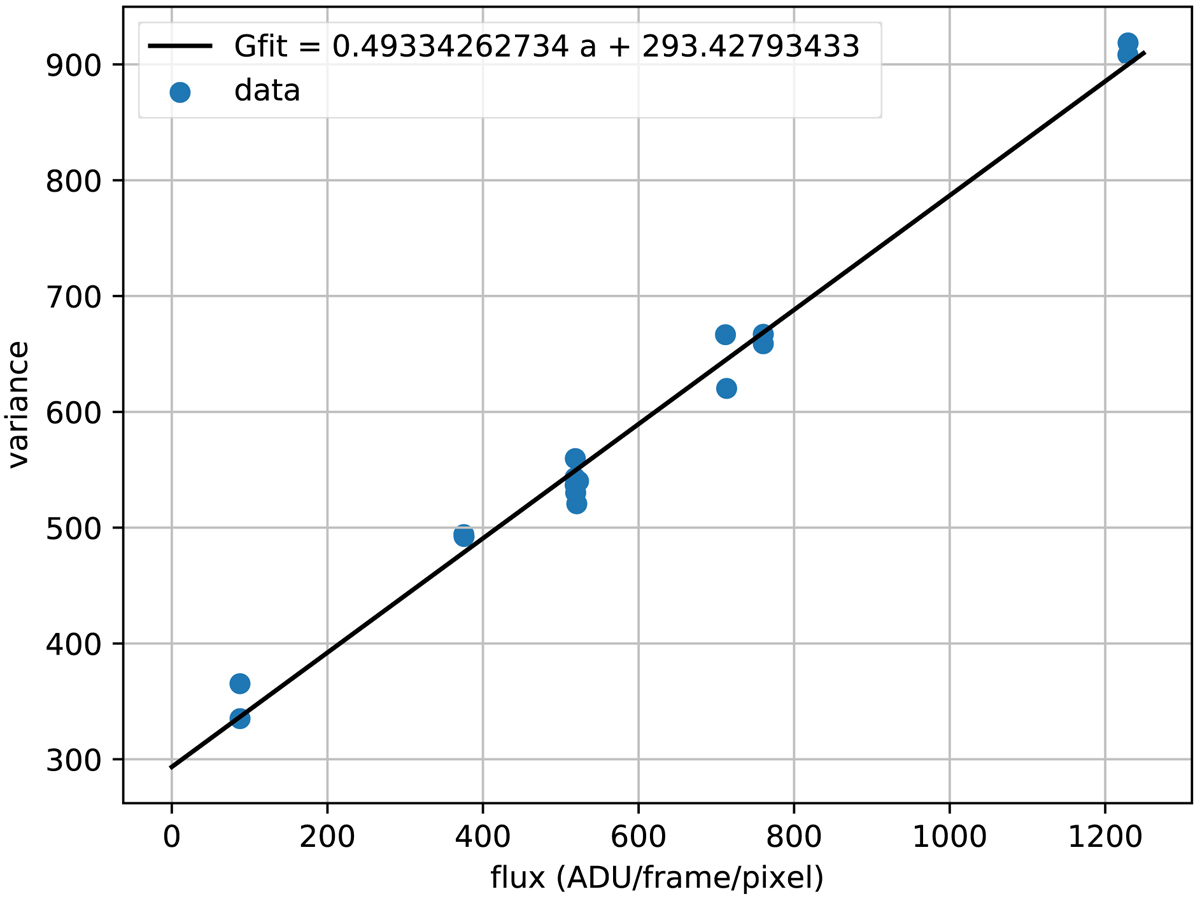
Mean-variance curve at avalanche gain = 1 (no avalanche process). The horizontal axis shows the mean flux in ADU/frame/pixel while the vertical axis gives the temporal variance. The blue dots are the data points. The black line is the fit of a linear function on the data points.
Current usage metrics show cumulative count of Article Views (full-text article views including HTML views, PDF and ePub downloads, according to the available data) and Abstracts Views on Vision4Press platform.
Data correspond to usage on the plateform after 2015. The current usage metrics is available 48-96 hours after online publication and is updated daily on week days.
Initial download of the metrics may take a while.