Free Access
Fig. 9
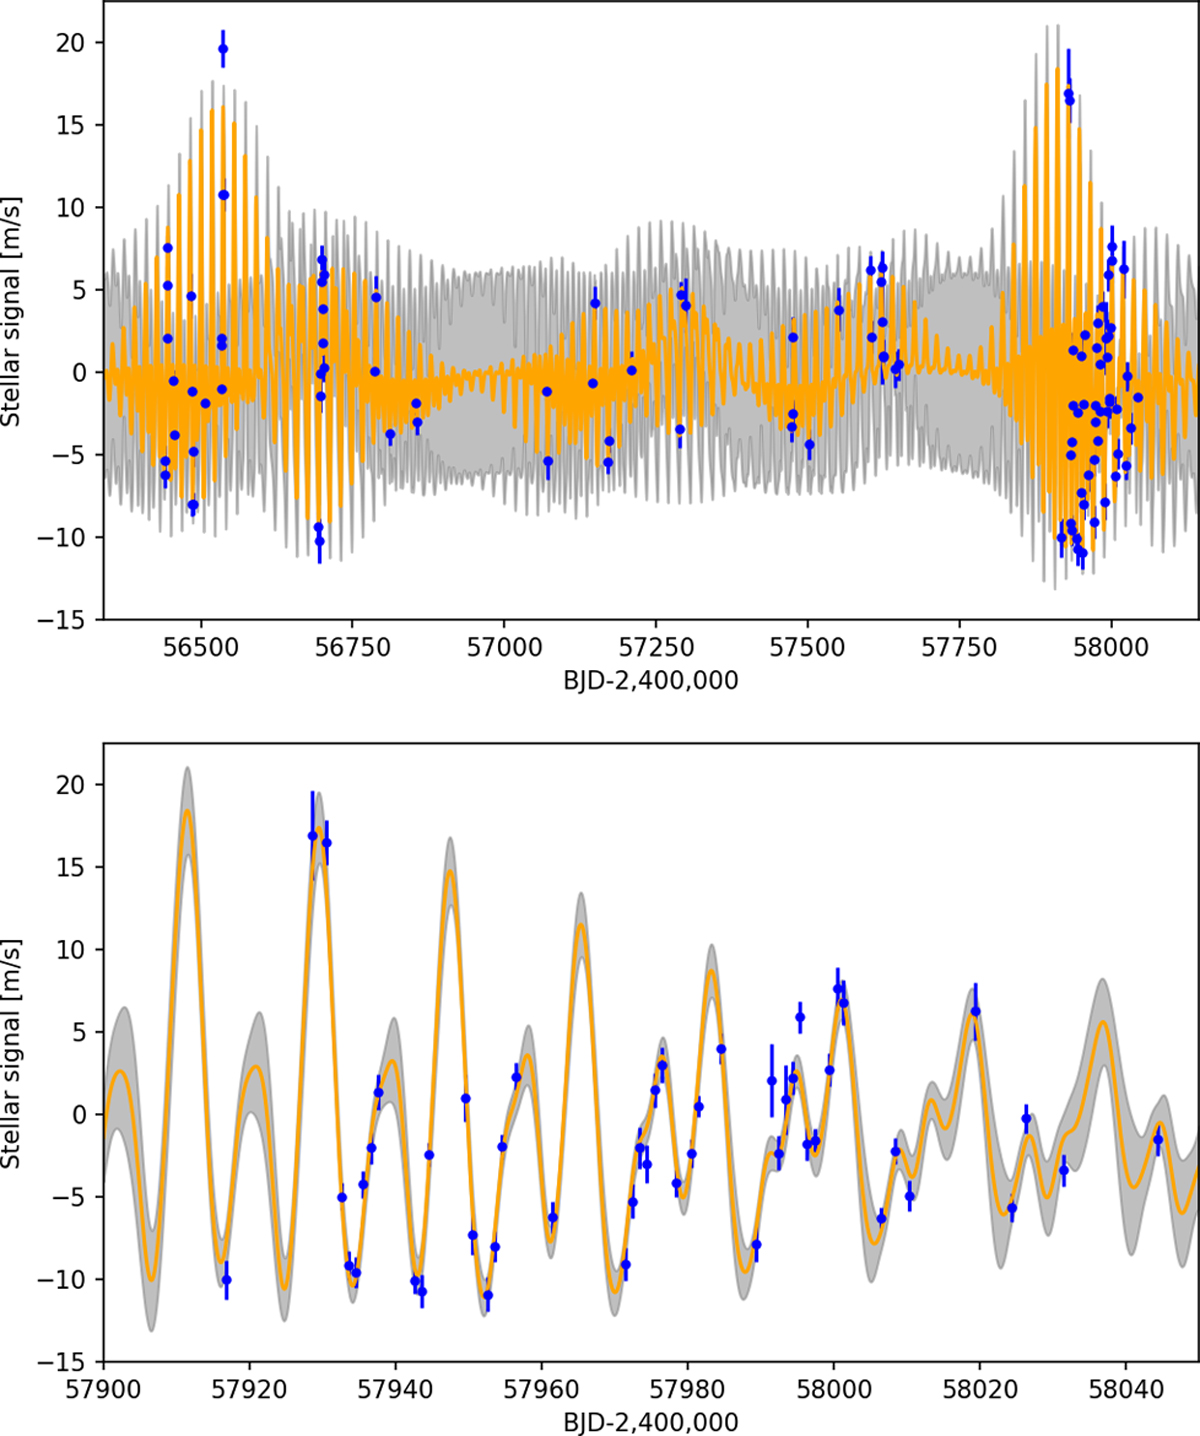
Upper panel: best-fit stellar quasi-periodic signal obtained from the GP + 1 planet model (orange line) compared to the RV residuals (blue points). Lower panel: magnification of the last HARPS-N observing season. The grey area represents the ± 1σ uncertainties of the stellar activity model.
Current usage metrics show cumulative count of Article Views (full-text article views including HTML views, PDF and ePub downloads, according to the available data) and Abstracts Views on Vision4Press platform.
Data correspond to usage on the plateform after 2015. The current usage metrics is available 48-96 hours after online publication and is updated daily on week days.
Initial download of the metrics may take a while.