Free Access
Fig. 7
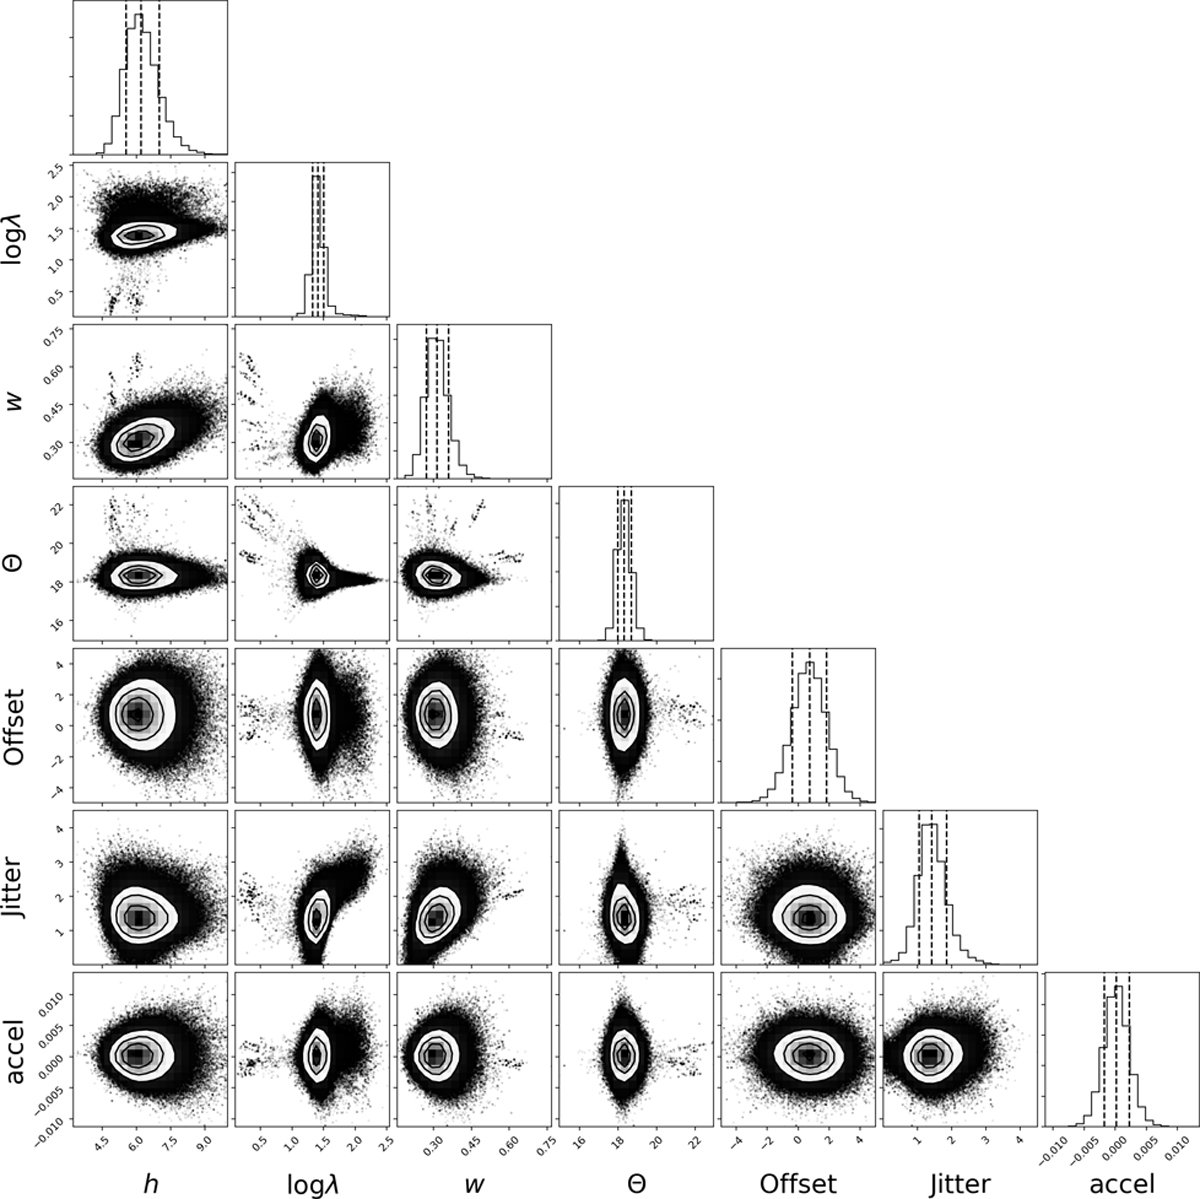
Posterior distributions of the fitted (hyper-)parameters of the pure GP model applied to the RV time series. The vertical dashed lines denote the median and the 16 th and 84 th percentiles.
Current usage metrics show cumulative count of Article Views (full-text article views including HTML views, PDF and ePub downloads, according to the available data) and Abstracts Views on Vision4Press platform.
Data correspond to usage on the plateform after 2015. The current usage metrics is available 48-96 hours after online publication and is updated daily on week days.
Initial download of the metrics may take a while.