Free Access
Fig. 2
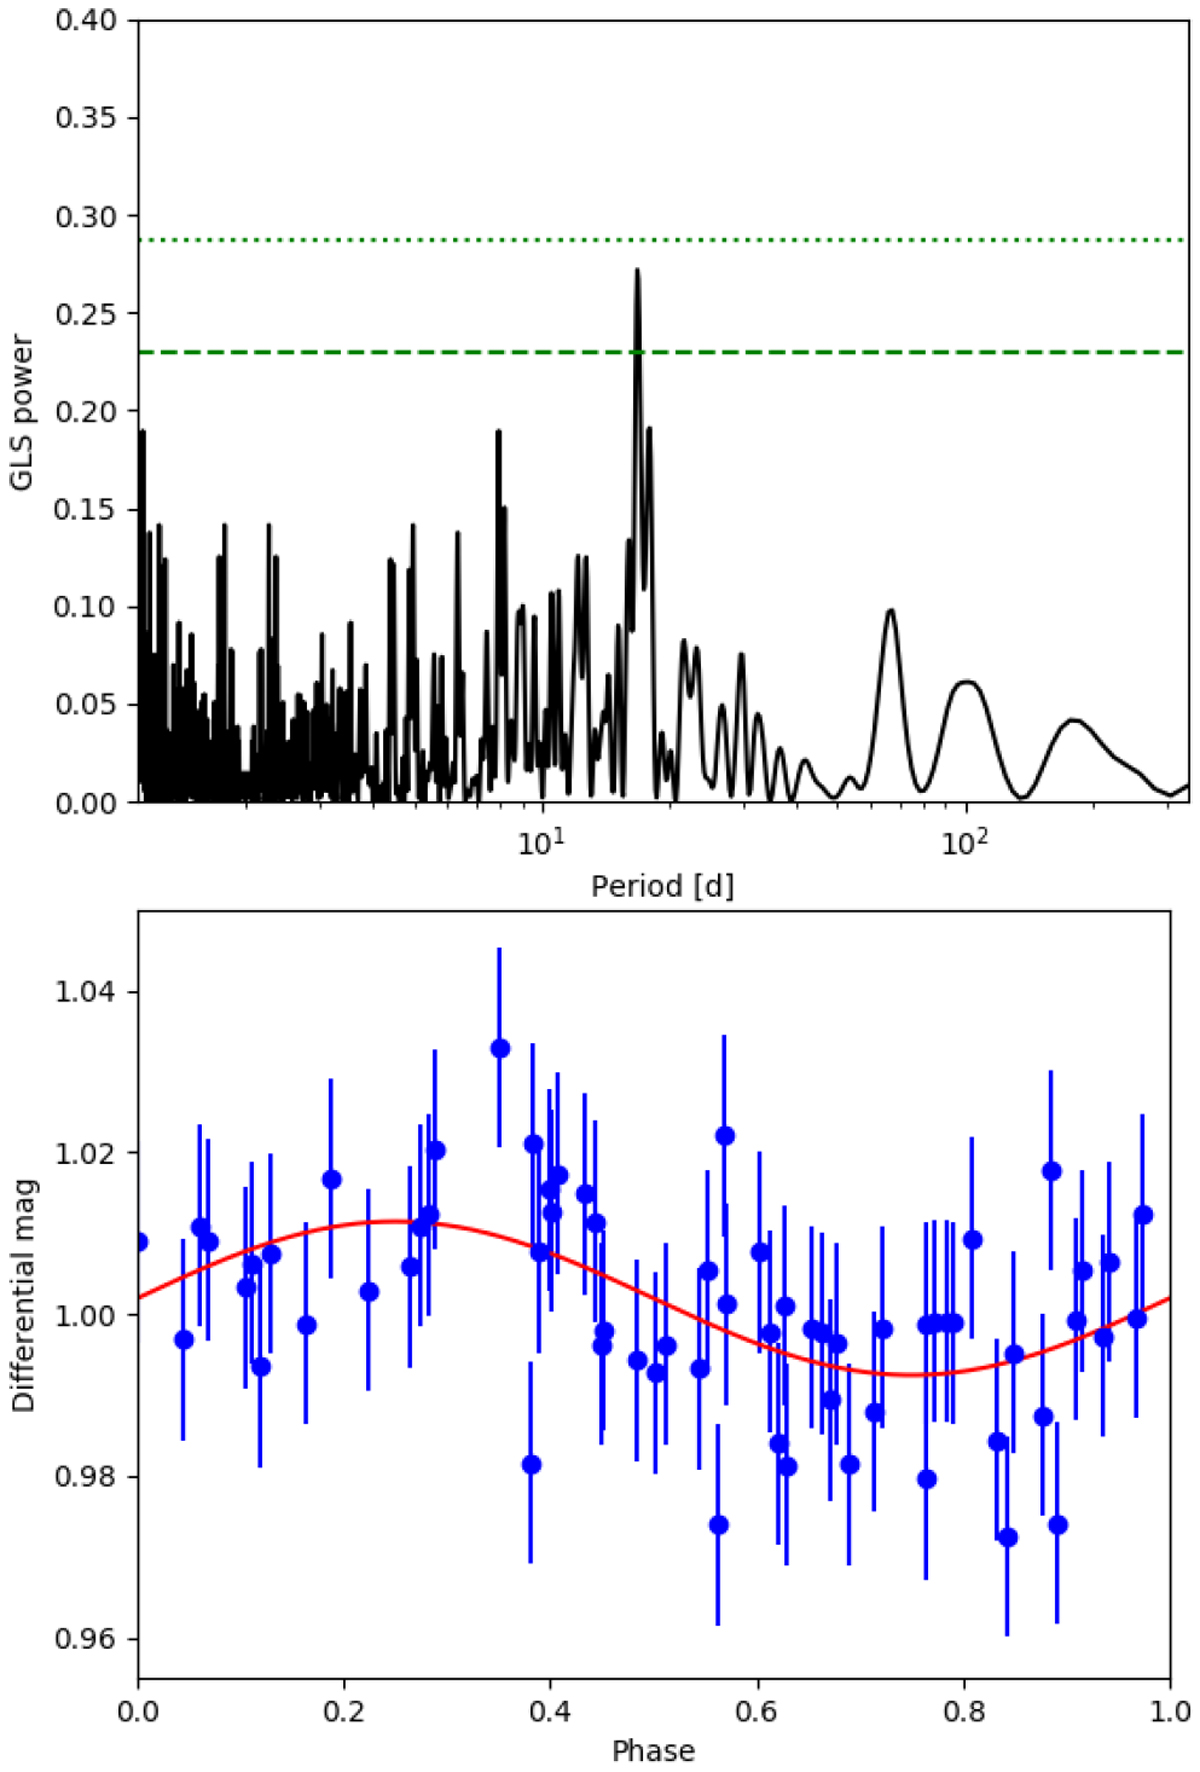
Upperpanel: GLS periodograms of the APACHE photometric data. The dotted and dashed horizontal lines indicate the 1 and 10% FAP levels, respectively. Lower panel: APACHE light curve phase-folded over the 16.85 d period found by the GLS periodogram. The red line represents the best-fit model.
Current usage metrics show cumulative count of Article Views (full-text article views including HTML views, PDF and ePub downloads, according to the available data) and Abstracts Views on Vision4Press platform.
Data correspond to usage on the plateform after 2015. The current usage metrics is available 48-96 hours after online publication and is updated daily on week days.
Initial download of the metrics may take a while.