Fig. 6.
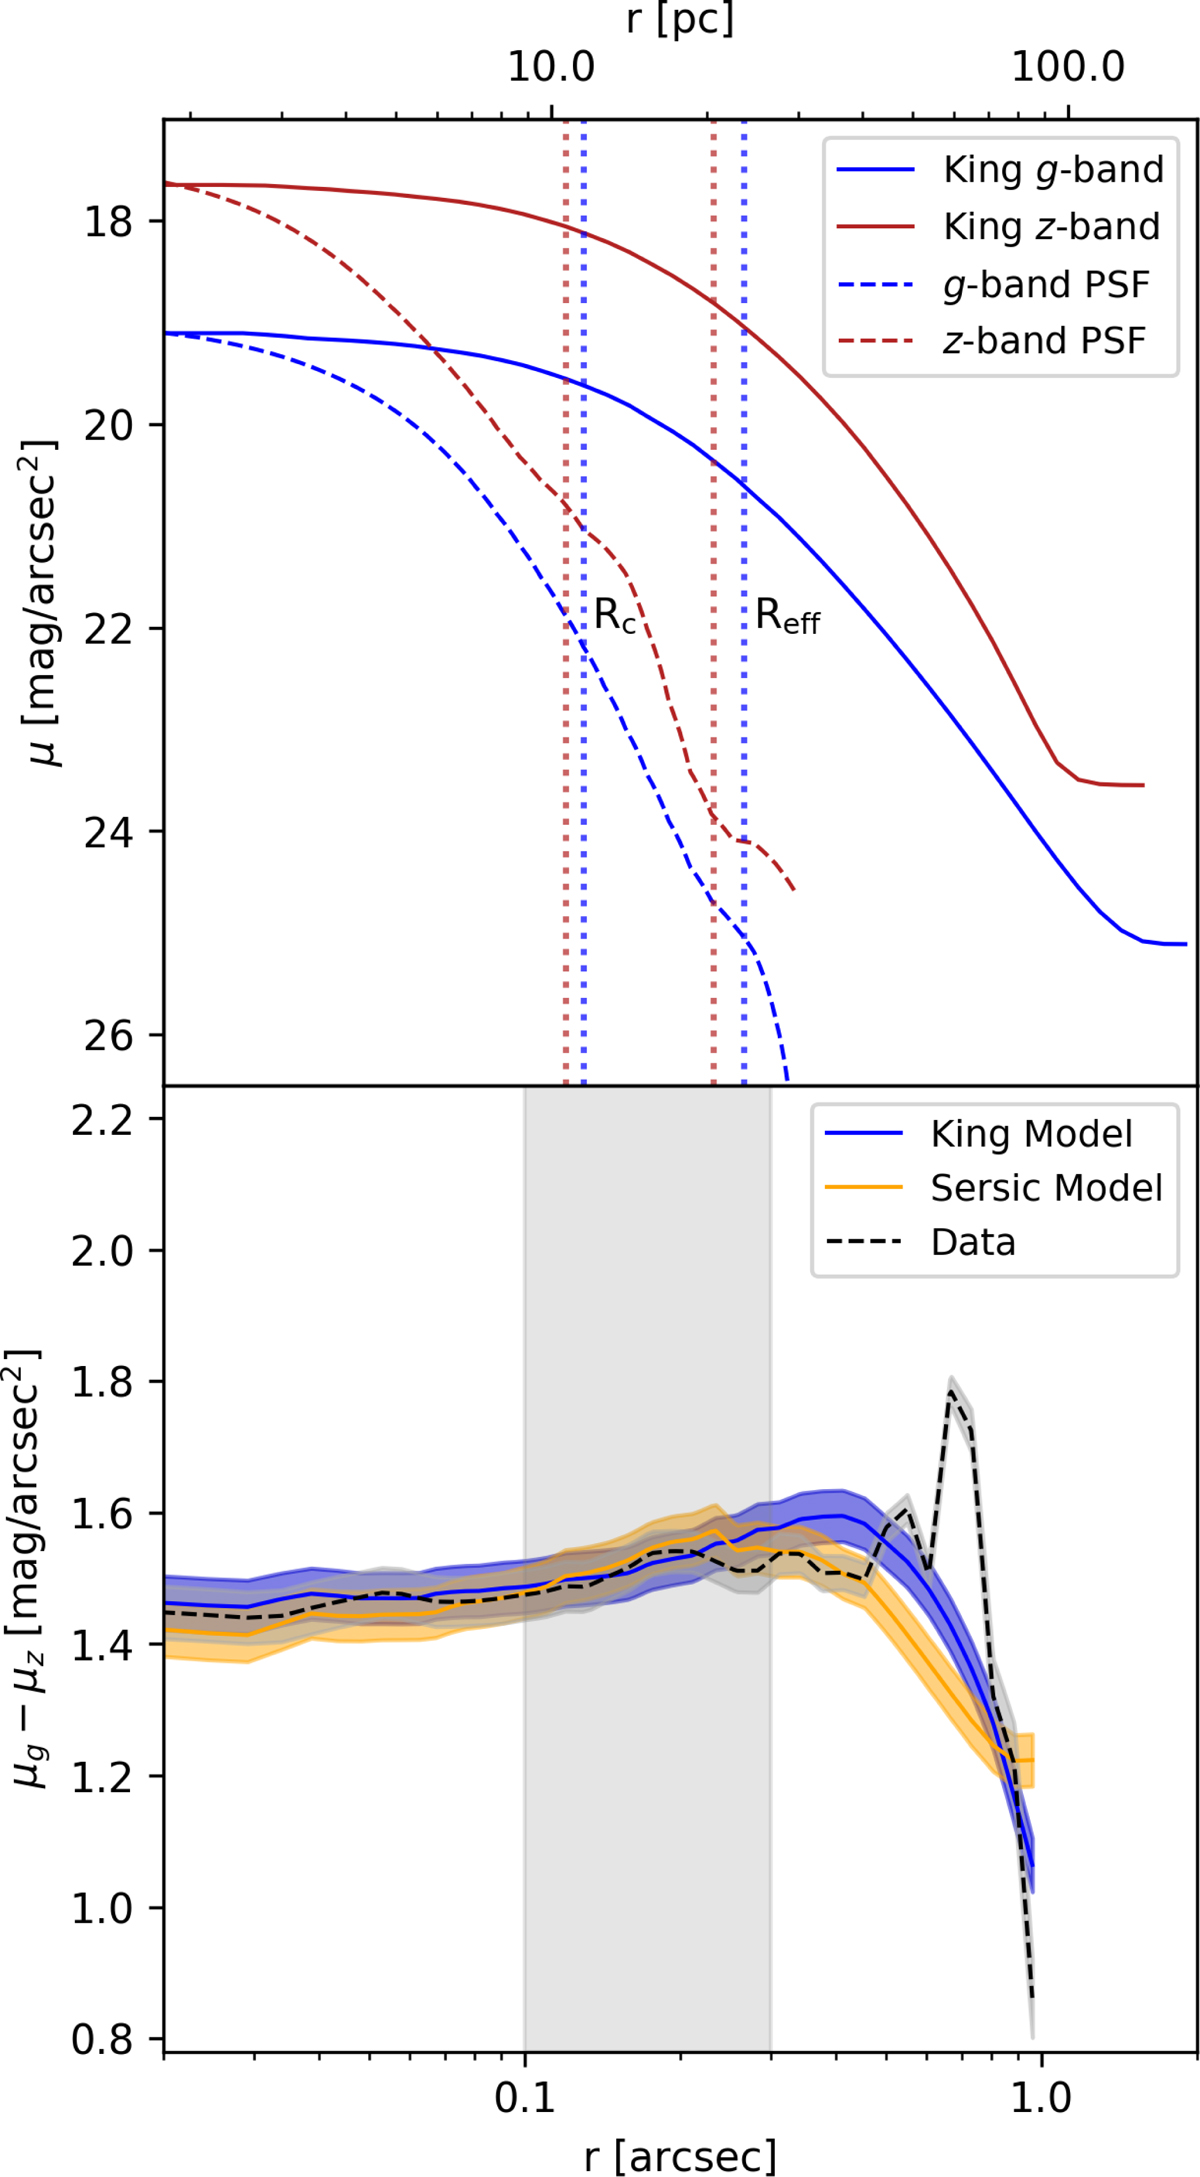
Surface brightness and colour profiles. Top: UCD model surface brightness profiles for the generalized King models. We also show the profiles from the 10× oversampled PSFs shifted to match the respective filter at the centre. The vertical lines give the positions of the core and effective radii in the two filters. Bottom: μg − μz colour profile. The blue line represents the King model colour profile, the black dotted line the data. For comparison, we also show the colour profile from the single-component Sersic model. The shaded areas show the 1σ uncertainties from the ELLIPSE extraction and the grey shaded area shows the range we use to fit the gradient.
Current usage metrics show cumulative count of Article Views (full-text article views including HTML views, PDF and ePub downloads, according to the available data) and Abstracts Views on Vision4Press platform.
Data correspond to usage on the plateform after 2015. The current usage metrics is available 48-96 hours after online publication and is updated daily on week days.
Initial download of the metrics may take a while.