Fig. 5.
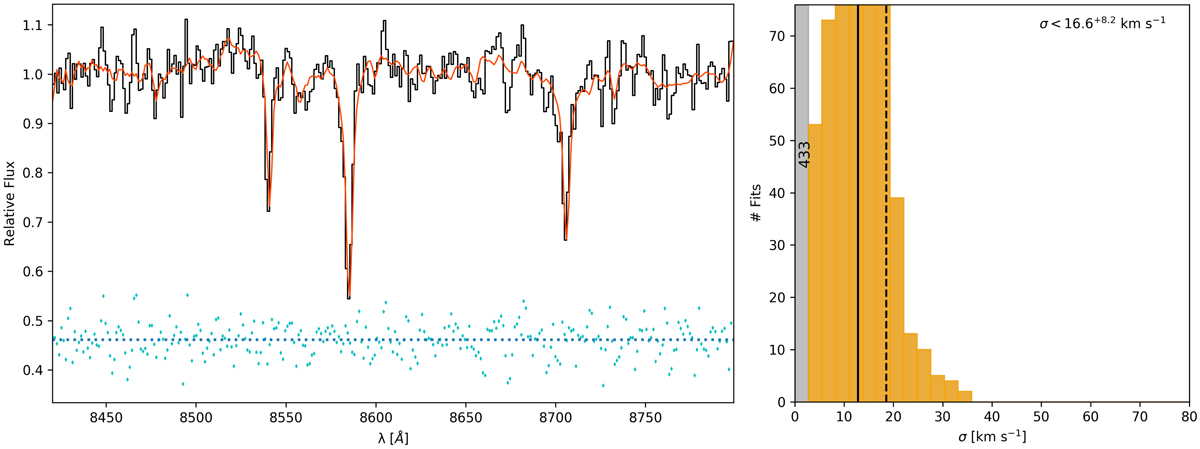
Left: Ca Triplet region of the MUSE spectrum. The PPXF fit using the Ca Triplet library shown in red. Right: distributions of velocity dispersions using a MC approach with 1000 realizations of the spectrum. The 433 fits that returned zero are shown in the grey bar. The solid line gives the mean of the distribution after removing the runs that returned zero. The dotted line gives the upper 1σ deviation.
Current usage metrics show cumulative count of Article Views (full-text article views including HTML views, PDF and ePub downloads, according to the available data) and Abstracts Views on Vision4Press platform.
Data correspond to usage on the plateform after 2015. The current usage metrics is available 48-96 hours after online publication and is updated daily on week days.
Initial download of the metrics may take a while.