Fig. 3.
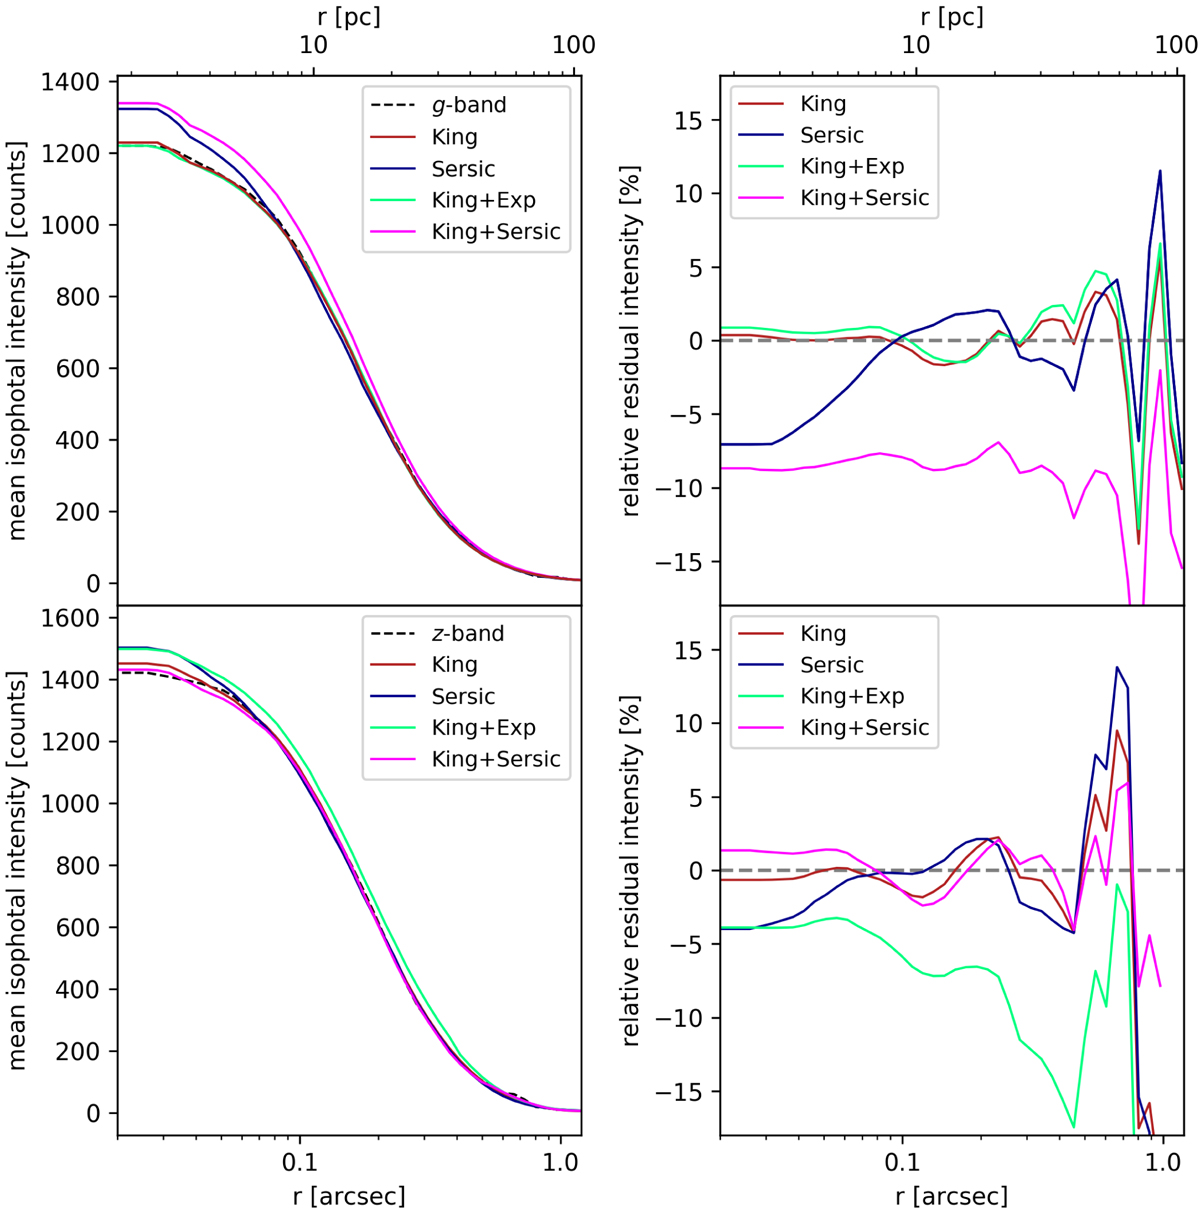
Left column: UCD 1D profiles of the mean isophotal intensity versus radius in the g-band (first row) and z-band (second row) filter. The data is shown with the black dotted line, the King model fit in red, and the Sérsic model fit in blue. The two-component fits are shown in cyan (King + Exponential) and magenta (King + Sérsic). Right column: Relative residual profiles for the four different models. Above ≳5″ the flux drops to the background level, creating noisy radial residuals.
Current usage metrics show cumulative count of Article Views (full-text article views including HTML views, PDF and ePub downloads, according to the available data) and Abstracts Views on Vision4Press platform.
Data correspond to usage on the plateform after 2015. The current usage metrics is available 48-96 hours after online publication and is updated daily on week days.
Initial download of the metrics may take a while.