Fig. 2.
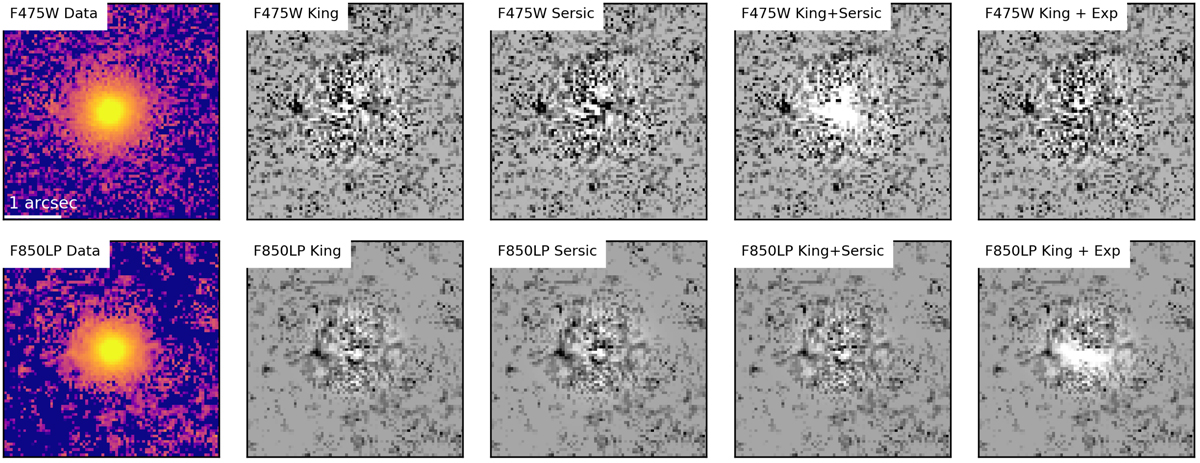
Two-dimensional structural analysis. First column: HST UCD images in the F475W filter (g-band, first row) and F850LP (z-band, second row) after an ELLIPSE model of the galaxy background is subtracted. The second and third columns show residual images after subtracting a single generalized King model or a Sérsic model, respectively. The third and fourth columns show residuals after subtracting two-component models with a King and Sérsic and a King and exponential model, respectively. Each panel shows a 3″ × 3″ (266 × 266 pc) cut out. Black and white colours show positive and negative residuals. Figure 3 gives radial relative residuals from the various models.
Current usage metrics show cumulative count of Article Views (full-text article views including HTML views, PDF and ePub downloads, according to the available data) and Abstracts Views on Vision4Press platform.
Data correspond to usage on the plateform after 2015. The current usage metrics is available 48-96 hours after online publication and is updated daily on week days.
Initial download of the metrics may take a while.