Fig. 3
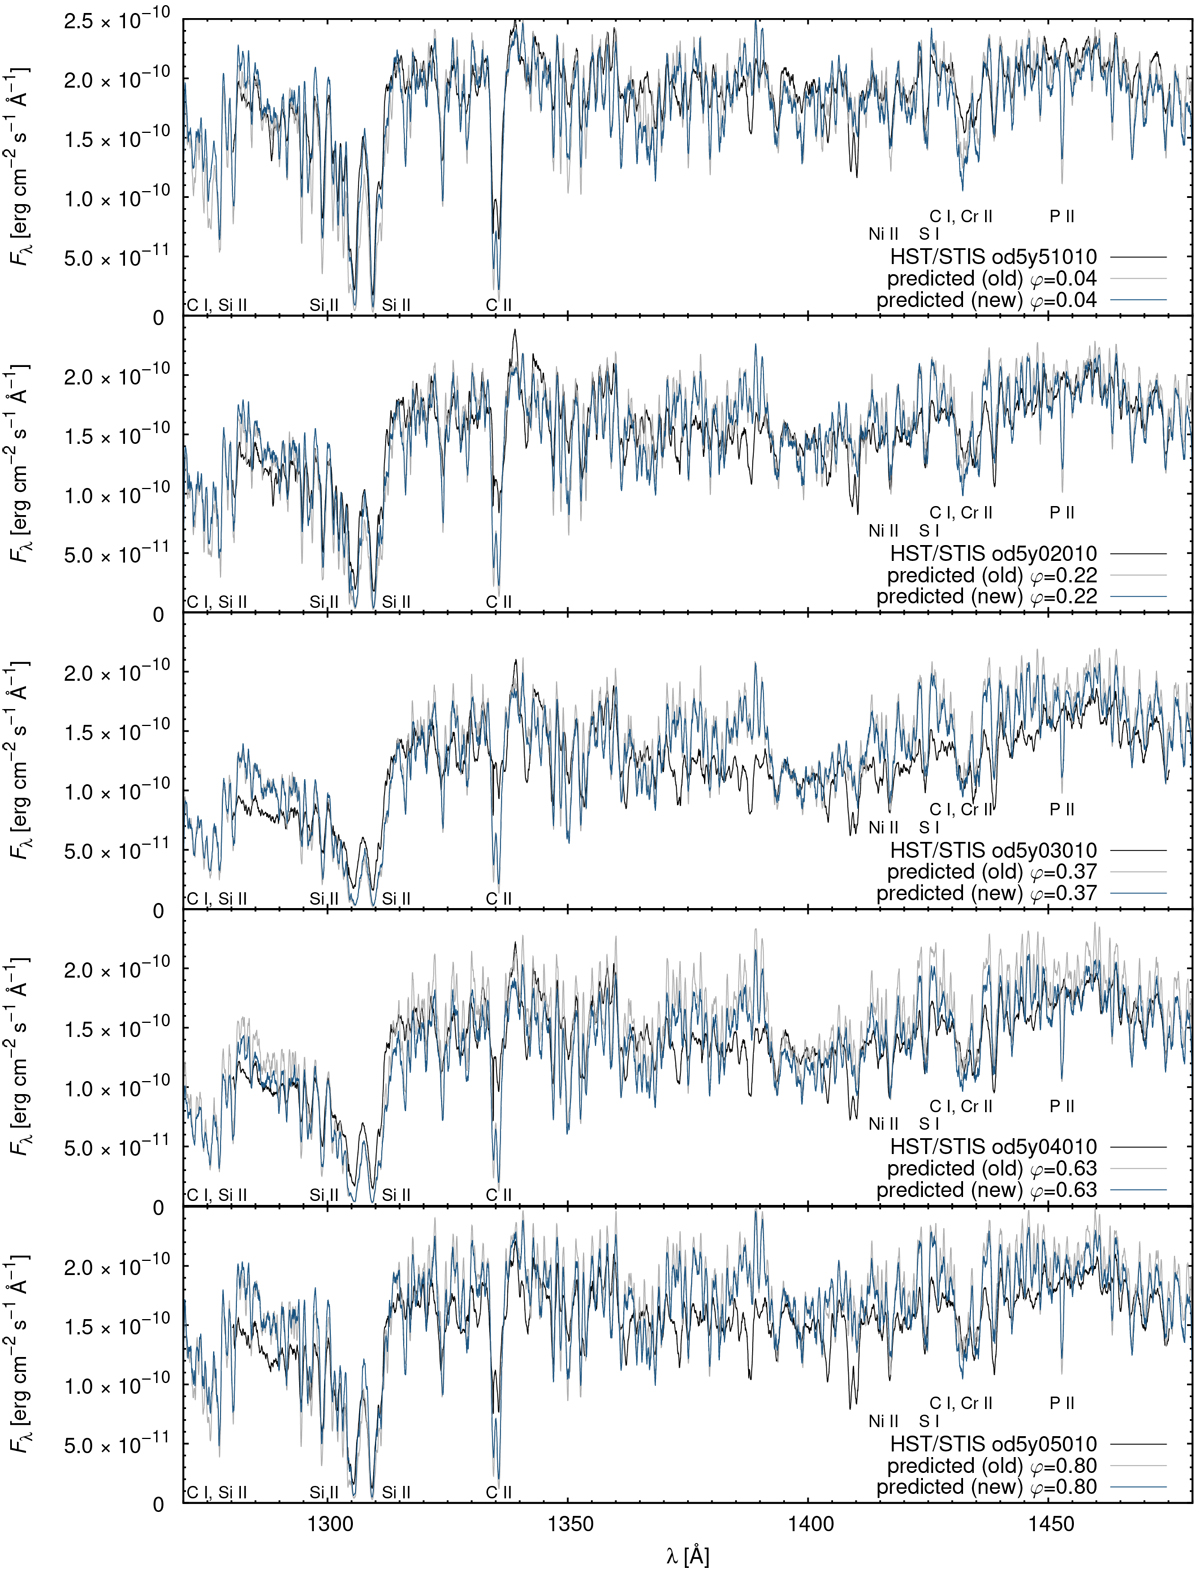
Predicted and observed (HST, black line) flux in selected phases for the wavelength range 1270–1480 Å. The gray line denotes spectra calculated using Kuschnig et al. (1999) surface abundance distribution and blue line denotes spectra calculated using Kochukhov et al. (2014) surface abundance distribution. Individual strong lines and iron line blends are identified.
Current usage metrics show cumulative count of Article Views (full-text article views including HTML views, PDF and ePub downloads, according to the available data) and Abstracts Views on Vision4Press platform.
Data correspond to usage on the plateform after 2015. The current usage metrics is available 48-96 hours after online publication and is updated daily on week days.
Initial download of the metrics may take a while.