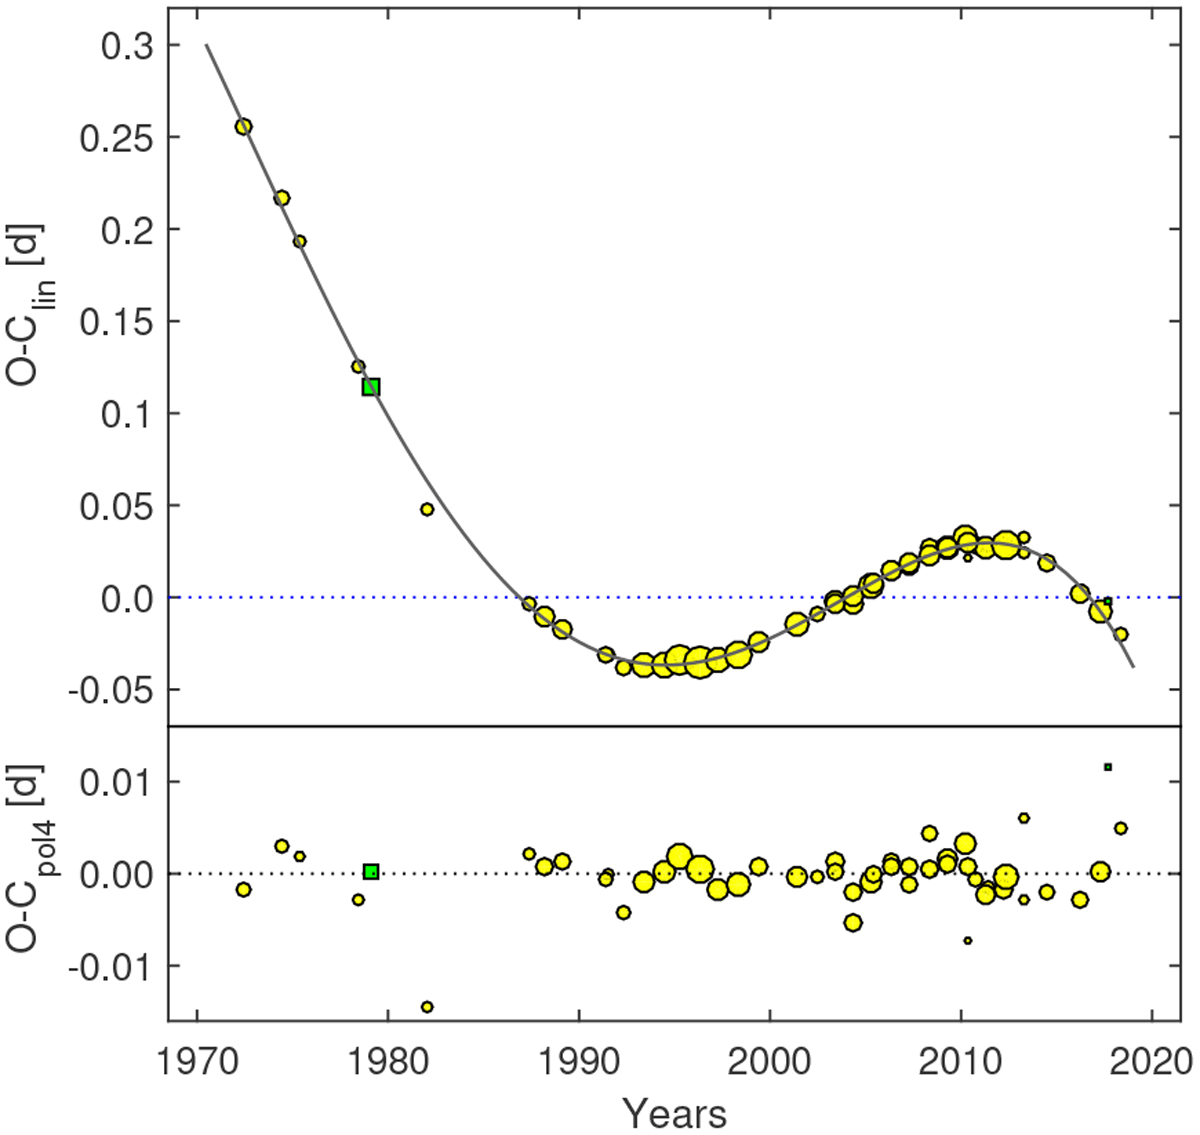
Fig. 2
Upper plot: O - Clin versus time in years. O is the moment of the zero phase and Clin = M01 + P1 × E. M01 and P1 are the parameters of the linear approximation of O(E) behavior, E is the number of rotational cycles elapsed from the initial epoch M01 and P1 is the mean rotational period in the interval 1970–2018; M01 = 2 452 650.9048 and P1 = 0.52070819 d. Nonlinearityof O - Clin is a result of variable rotational period P. O - Clin is fitted by a fourth-order polynomial (solid line). Bottom plot: residuals O - Cpol4 show that the model ensures the accuracy of ephemeris 0.0025 d or 0.005 in phase. Optical photometry is denoted using yellow circles and UV spectrophotometry derived from observed fluxes using green squares. Sizes of the symbols are inversely proportional to the square root of the uncertainties of the determinations of O times derived from individual data sources.
Current usage metrics show cumulative count of Article Views (full-text article views including HTML views, PDF and ePub downloads, according to the available data) and Abstracts Views on Vision4Press platform.
Data correspond to usage on the plateform after 2015. The current usage metrics is available 48-96 hours after online publication and is updated daily on week days.
Initial download of the metrics may take a while.