Fig. 1
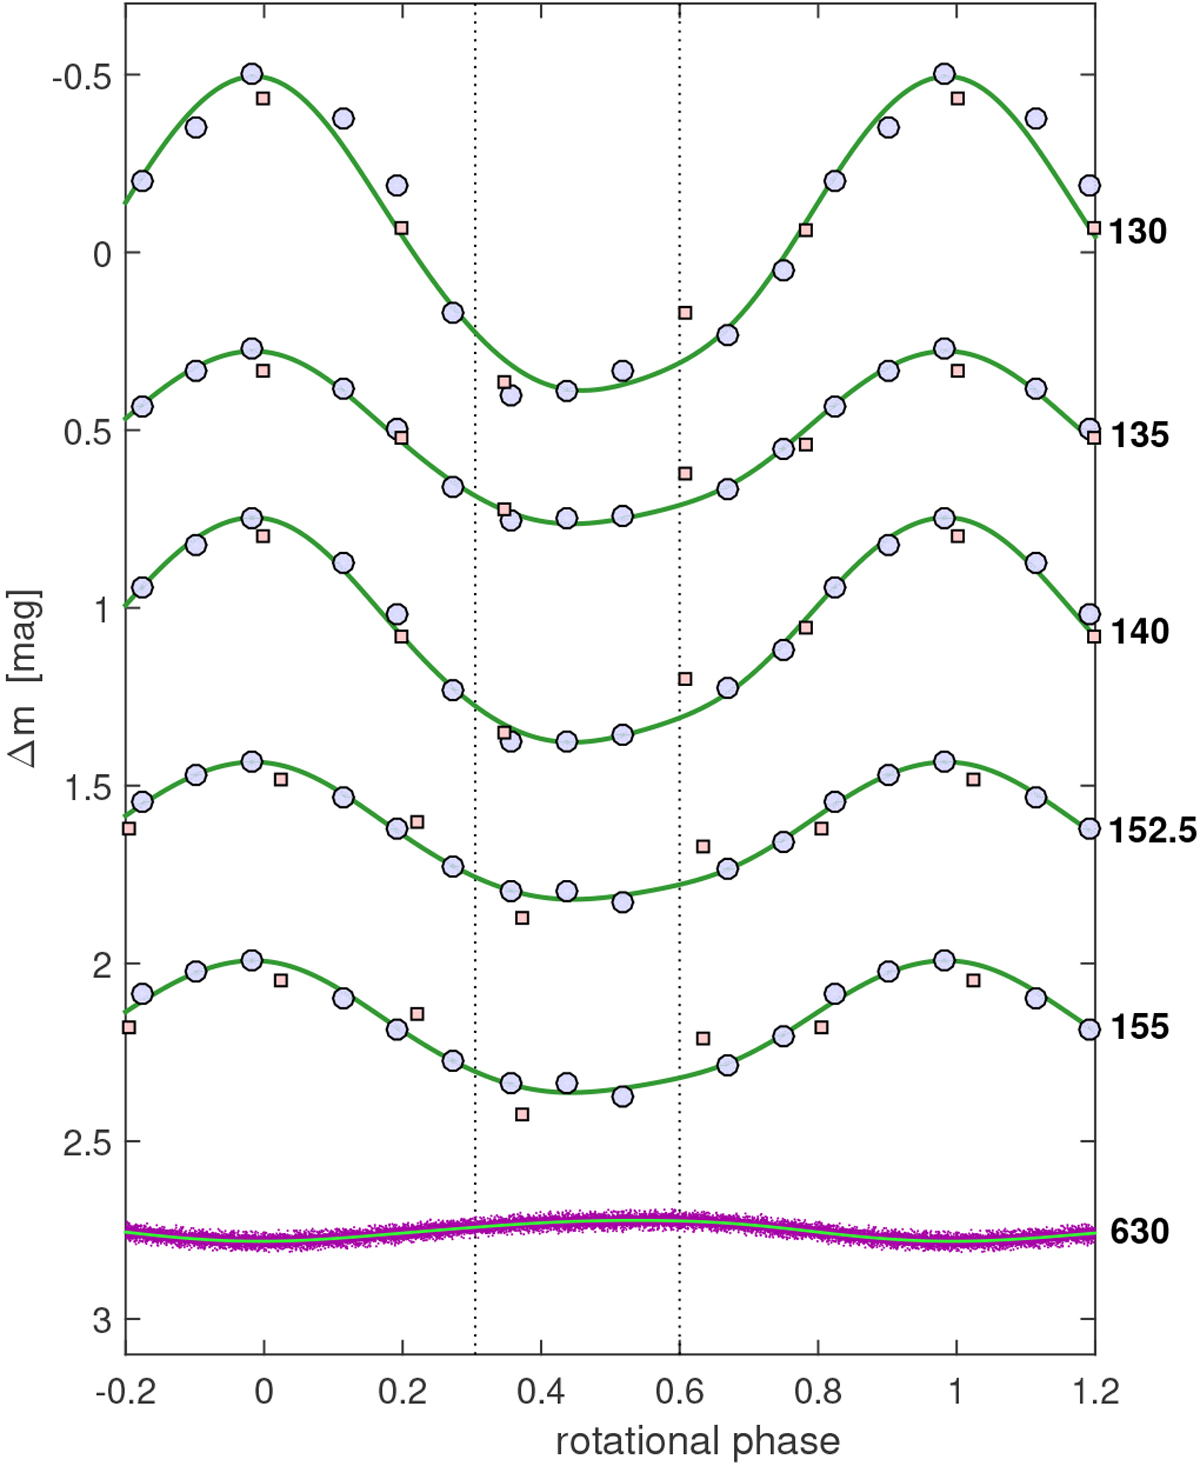
Comparison of light curves in far UV and red regions of CU Vir spectrum. Blue circles and red squares denote synthetic magnitudes derived from IUE and STIS spectra and lilac points are the measurements from SMEI satellite. Wavelengthsare expressed in nanometers. Phases are calculated using ephemeris Eq. (4) applying parameters given in Table 2. Green lines are the fits of the light curve phenomenological model Eq. (3), assuming two photometric spots with photocenters at the phases 0.303 and 0.598 (denoted using vertical black dotted lines). Light curves were plotted relative to the mean value of the fits and vertically shifted to separate individual plots.
Current usage metrics show cumulative count of Article Views (full-text article views including HTML views, PDF and ePub downloads, according to the available data) and Abstracts Views on Vision4Press platform.
Data correspond to usage on the plateform after 2015. The current usage metrics is available 48-96 hours after online publication and is updated daily on week days.
Initial download of the metrics may take a while.