Fig. 8.
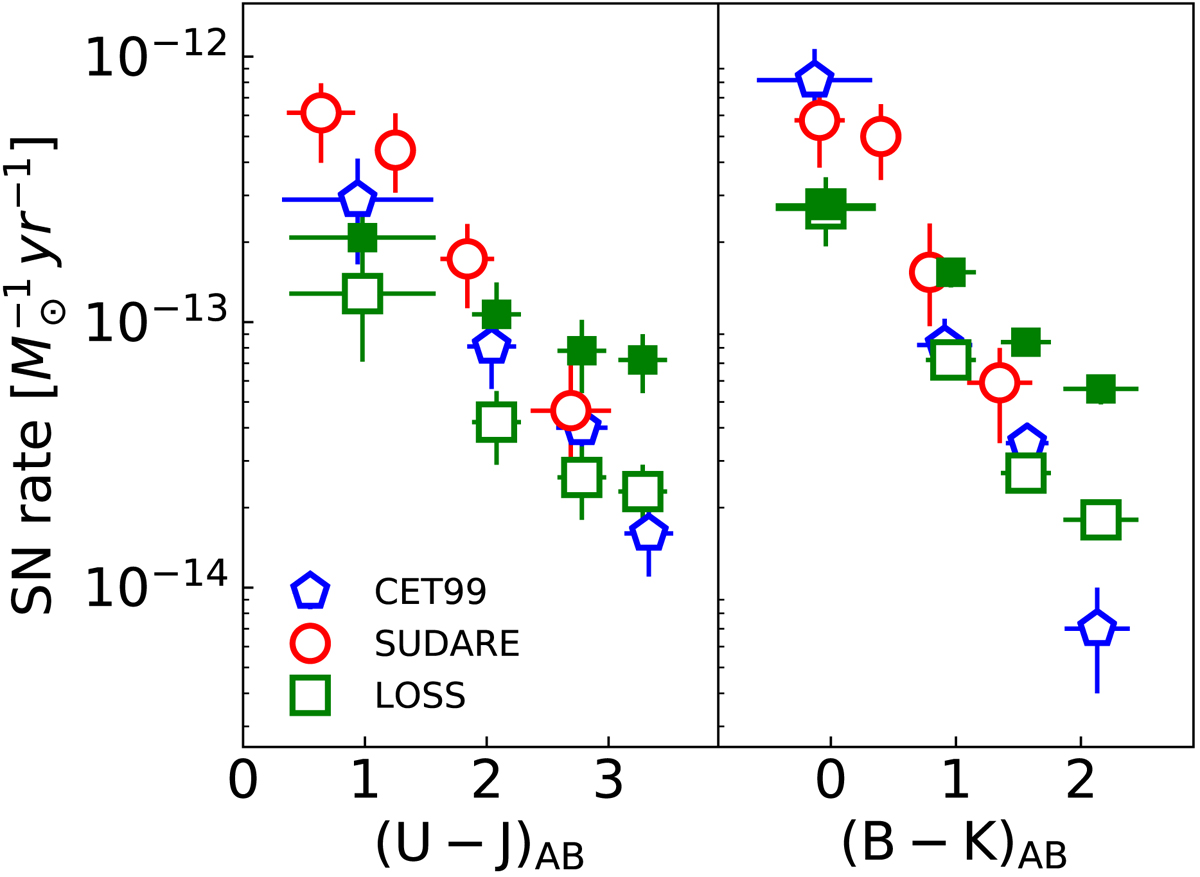
Observed correlations between the SNIa rate and the parent galaxy U − J (left) and B − K (right) colour in the SUDARE, CET99, and LOSS surveys. For the local surveys the stellar masses of the galaxies have been evaluated with the piece-wise relation discussed in the text. For the LOSS survey we also show as filled symbols the rate normalized to the mass derived from the BJ01-a relation. Colours are shown in the AB magnitude system. The horizontal error bars show the 1σ width of the galaxy distribution within each colour bin; the vertical error bars show the uncertainty on the rate from the statistics of the events.
Current usage metrics show cumulative count of Article Views (full-text article views including HTML views, PDF and ePub downloads, according to the available data) and Abstracts Views on Vision4Press platform.
Data correspond to usage on the plateform after 2015. The current usage metrics is available 48-96 hours after online publication and is updated daily on week days.
Initial download of the metrics may take a while.