Fig. B.1.
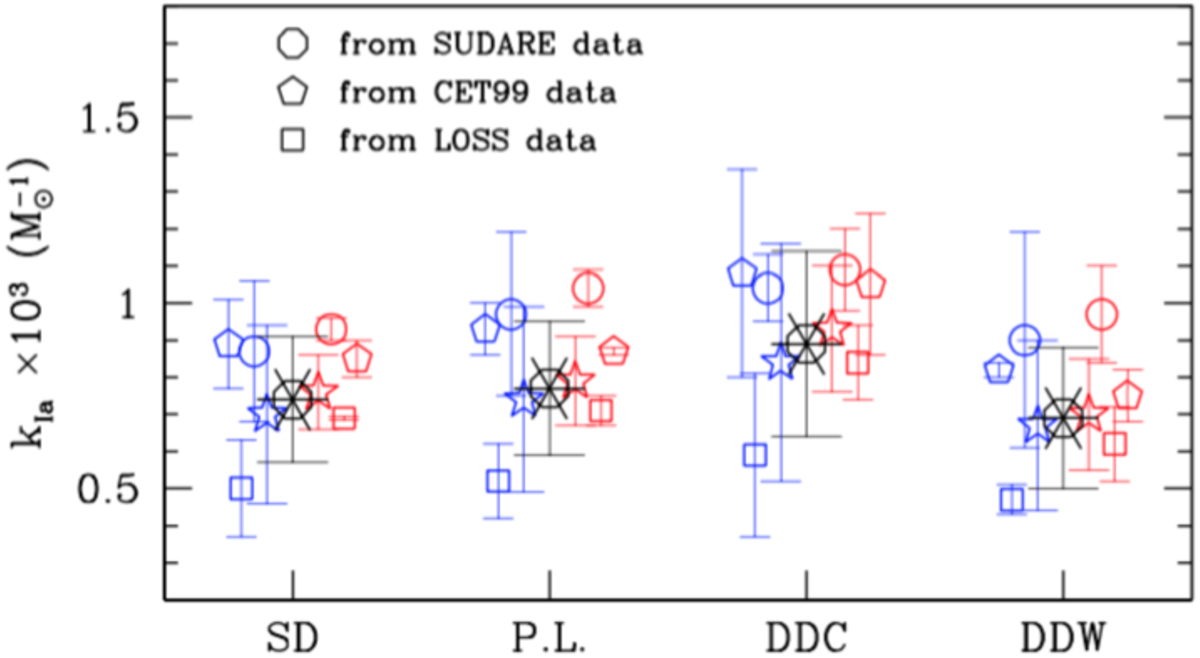
SNIa productivity resulting from the calibration of the models on the rates measured on galaxies with intermediate colour. The point type encodes the observational survey as in the legend. Each of the four groups refers to a different DTD labelled on the bottom axis. Within each group, points to the left (in blue) result from the calibration on galaxies binned in U − J (as in Fig. 10); points to the right (in red) from the calibration on galaxies binend in B − K (as in Fig. 11). The error bars reflect the statistical uncertainties of the measurements of the rates. For each DTD, the kIa values determined from the three surveys are combined to provide a weighted average kIa shown as a blue (left) and red (right) star. Finally, the asterisked circle (black) shows the value of kIa obtained combining the determinations from the two colours in a weighted mean. The error bars on the average values show the relative 1σ dispersions.
Current usage metrics show cumulative count of Article Views (full-text article views including HTML views, PDF and ePub downloads, according to the available data) and Abstracts Views on Vision4Press platform.
Data correspond to usage on the plateform after 2015. The current usage metrics is available 48-96 hours after online publication and is updated daily on week days.
Initial download of the metrics may take a while.