Fig. 2.
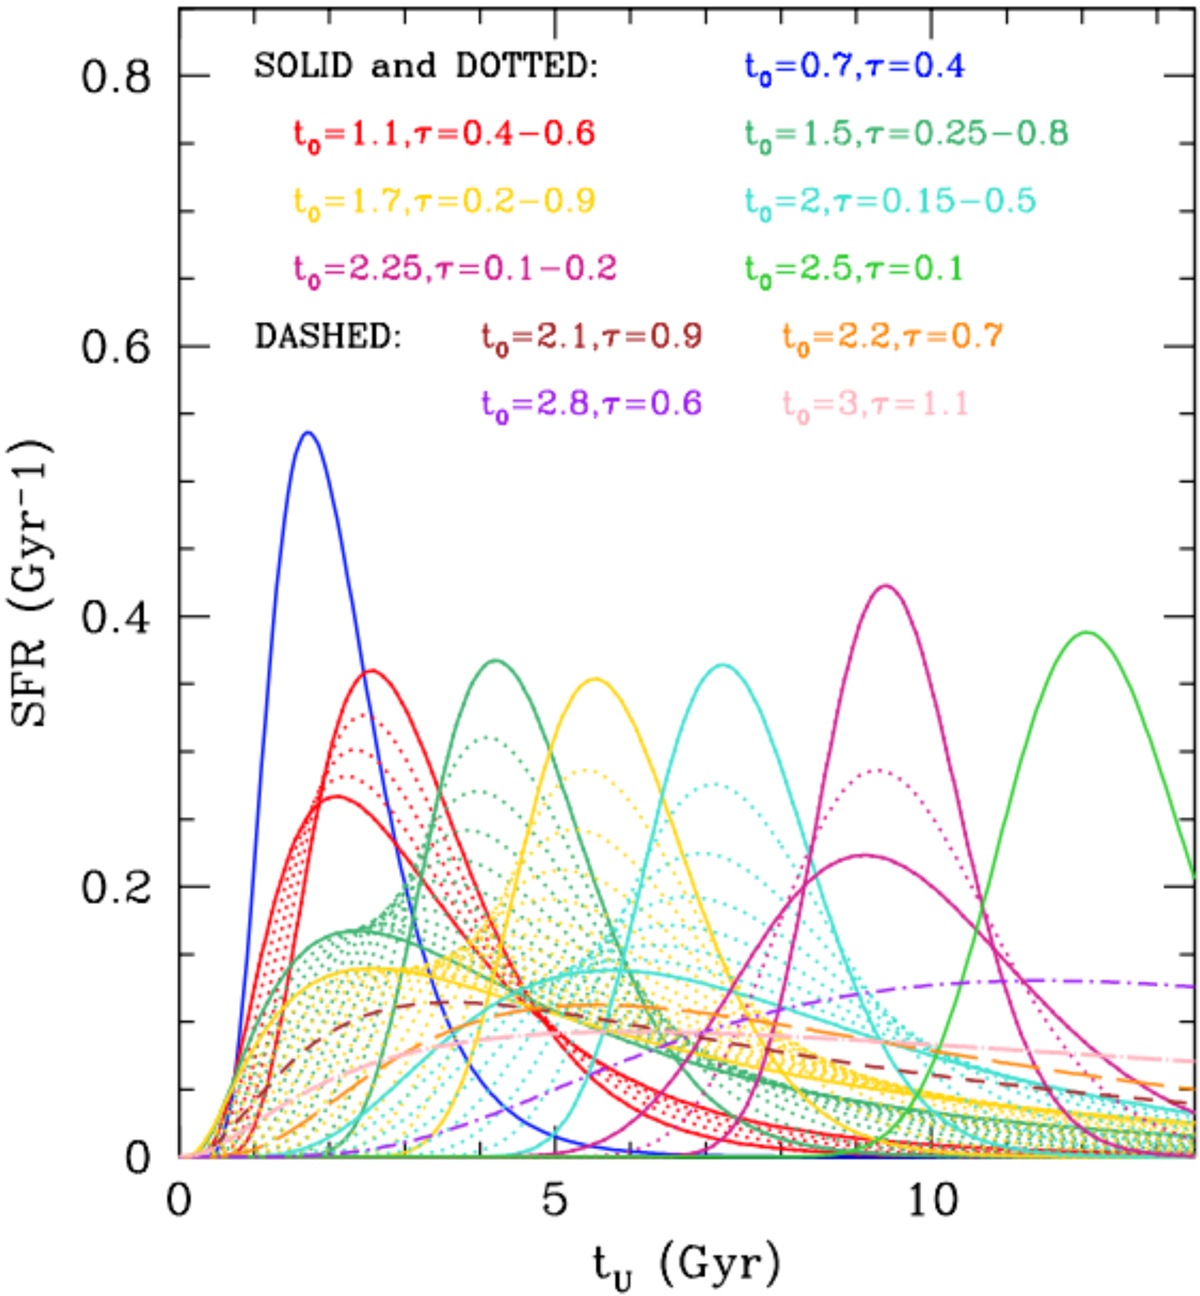
Selection of ψ(t) functions used to compute the models under the cosmological SFH proposed in Gladders et al. (2013). The colour encodes the values of the parameters t0 and τ as labelled. Solid and dotted lines of the same colour share the value of t0, but differ in τ, which is varied between a minimum and a maximum value in steps of 0.05 Gyr. The four curves plotted as dashed lines describe galaxies which fall outside the most populated region in Fig. 9 of Gladders et al. (2013). All time variables are in gigayear. For each ψ(t) function, the maxima occur when the age of the Universe is tU = exp(t0 − τ2).
Current usage metrics show cumulative count of Article Views (full-text article views including HTML views, PDF and ePub downloads, according to the available data) and Abstracts Views on Vision4Press platform.
Data correspond to usage on the plateform after 2015. The current usage metrics is available 48-96 hours after online publication and is updated daily on week days.
Initial download of the metrics may take a while.