Fig. A.4.
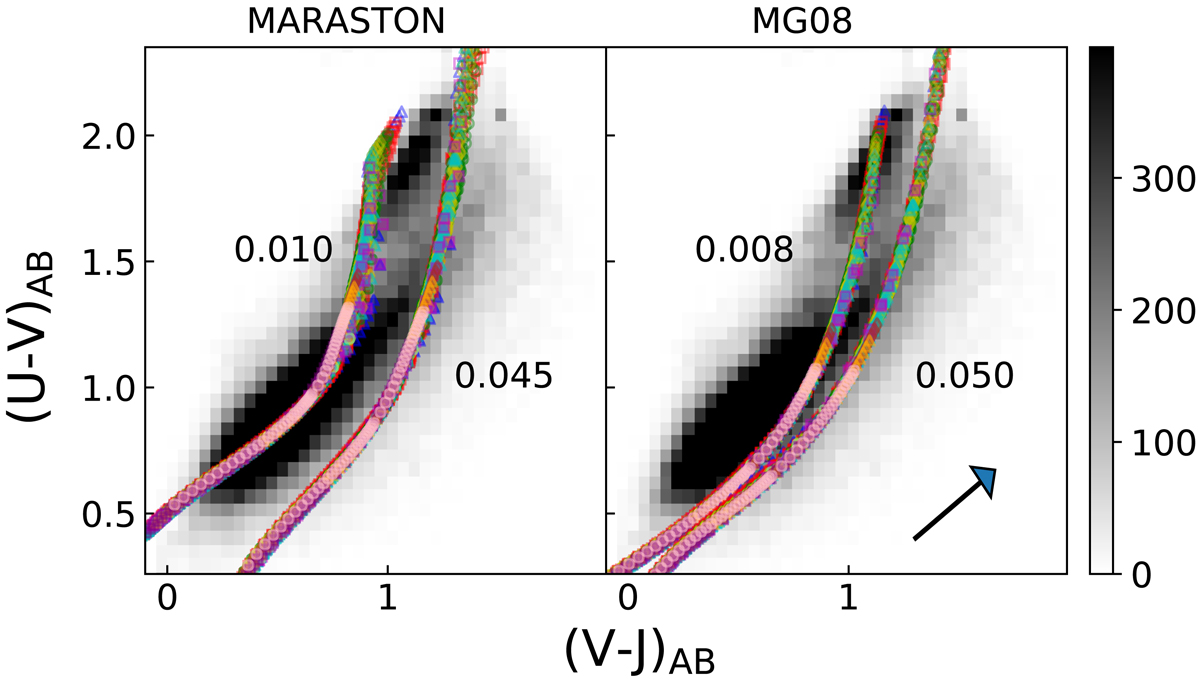
Two-colour diagram for log-normal SFHs using the Maraston (left panel) and the MG08 (right panel) SSP models with subsolar (upper loci) and supersolar (lower loci) metallicities. The models are superimposed on the distribution of the rest-frame colour of the SUDARE galaxy sample. The symbol and colour encoding is the same as in the bottom left panel of Fig. 4.
Current usage metrics show cumulative count of Article Views (full-text article views including HTML views, PDF and ePub downloads, according to the available data) and Abstracts Views on Vision4Press platform.
Data correspond to usage on the plateform after 2015. The current usage metrics is available 48-96 hours after online publication and is updated daily on week days.
Initial download of the metrics may take a while.