Fig. 15.
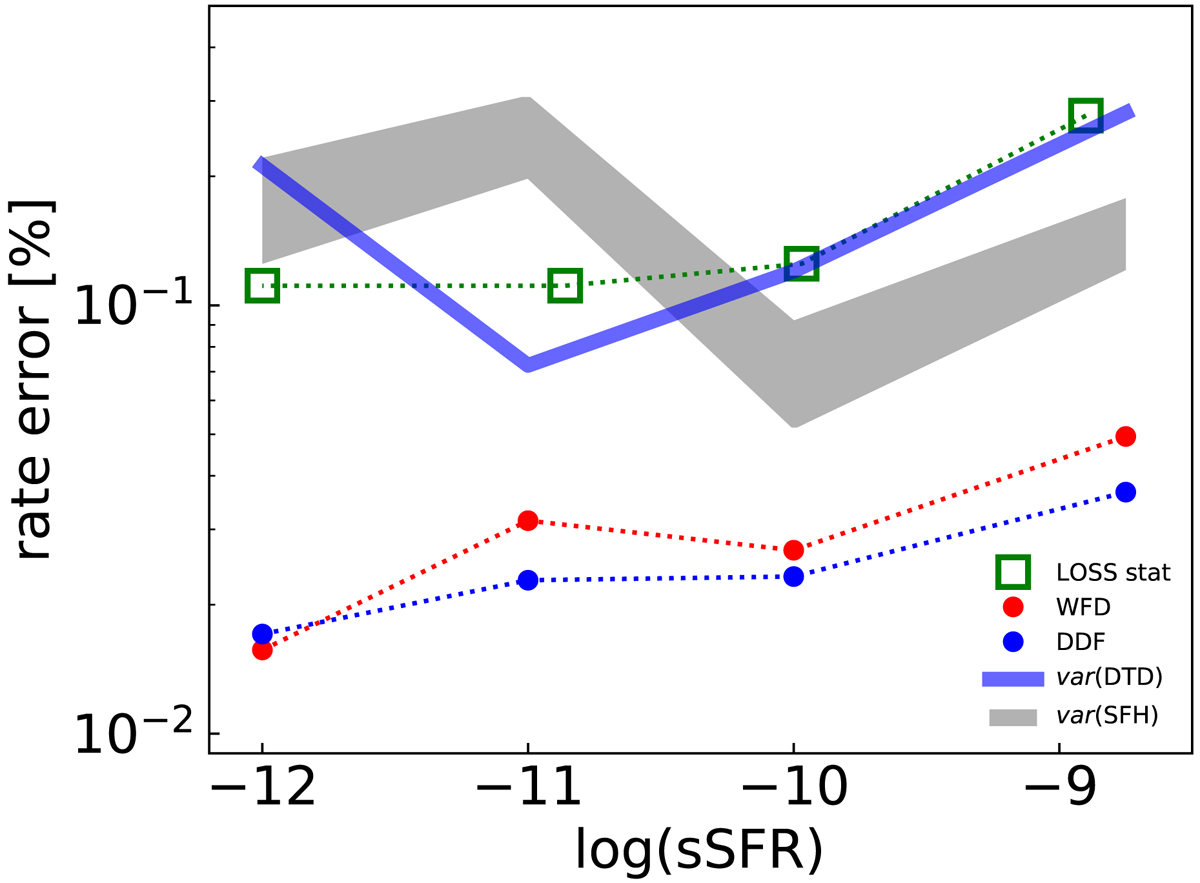
Theoretical and observational relative uncertainties on the value of the SNIa rate per unit mass as a function of the specific SFR. Open squares and dots show the statistical uncertainties for the LOSS survey and expected for the WFD and DDF LSST surveys, as labelled. The blue and grey stripes show the variance of the theoretical rates associated with different DTD models and different SFHs, respectively.
Current usage metrics show cumulative count of Article Views (full-text article views including HTML views, PDF and ePub downloads, according to the available data) and Abstracts Views on Vision4Press platform.
Data correspond to usage on the plateform after 2015. The current usage metrics is available 48-96 hours after online publication and is updated daily on week days.
Initial download of the metrics may take a while.