Free Access
Fig. 13.
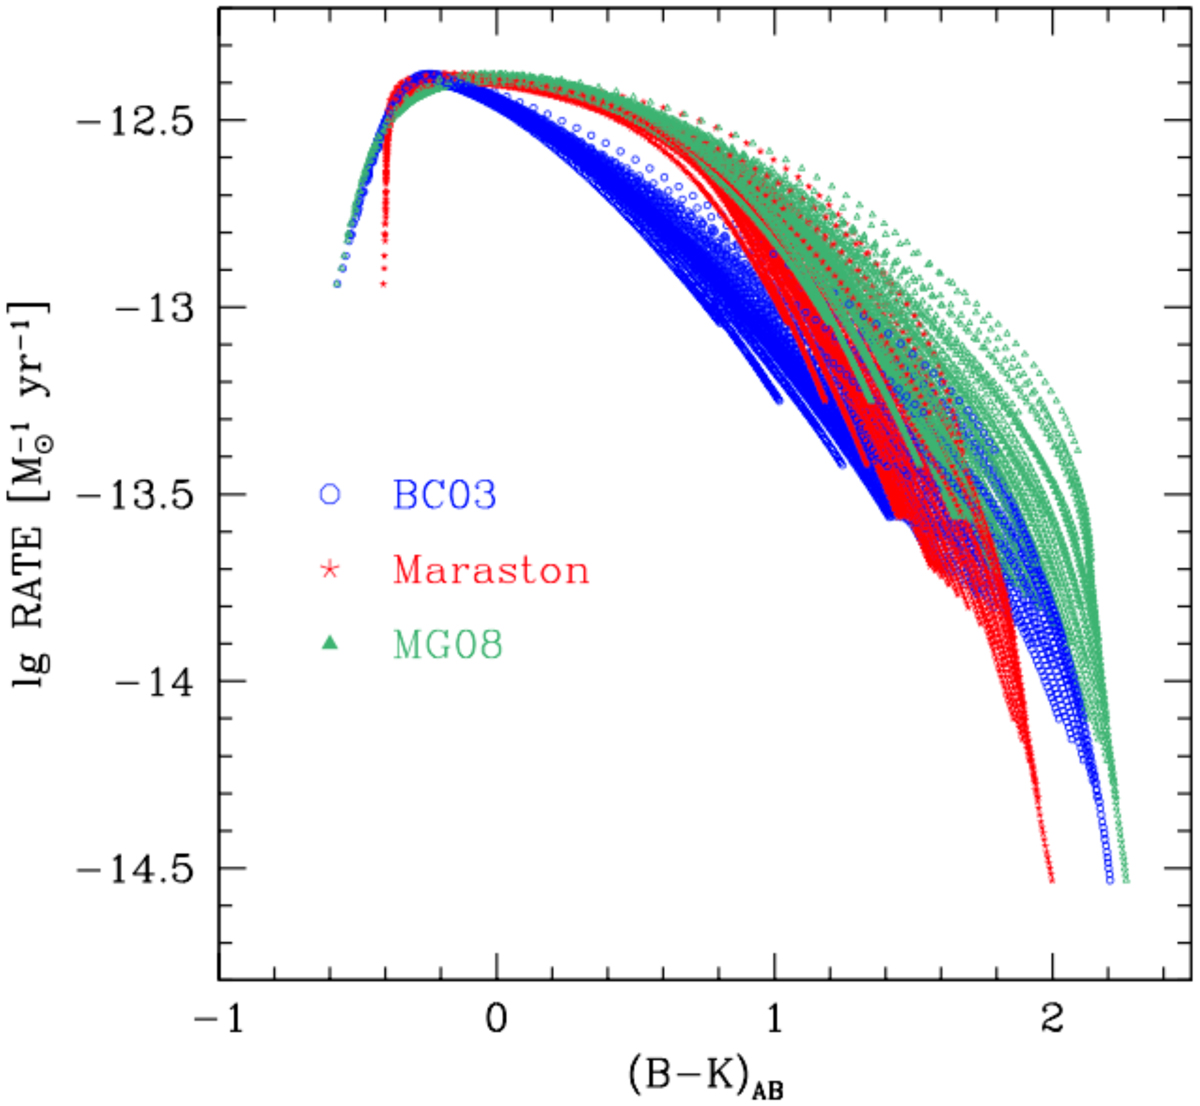
Theoretical correlation between the rate of SNIa and the colour of the parent galaxy for the three sets of SSP models as labelled, adopting the log-normal SFHs plotted in Fig. 2 and the SD DTD.
Current usage metrics show cumulative count of Article Views (full-text article views including HTML views, PDF and ePub downloads, according to the available data) and Abstracts Views on Vision4Press platform.
Data correspond to usage on the plateform after 2015. The current usage metrics is available 48-96 hours after online publication and is updated daily on week days.
Initial download of the metrics may take a while.