Fig. 12.
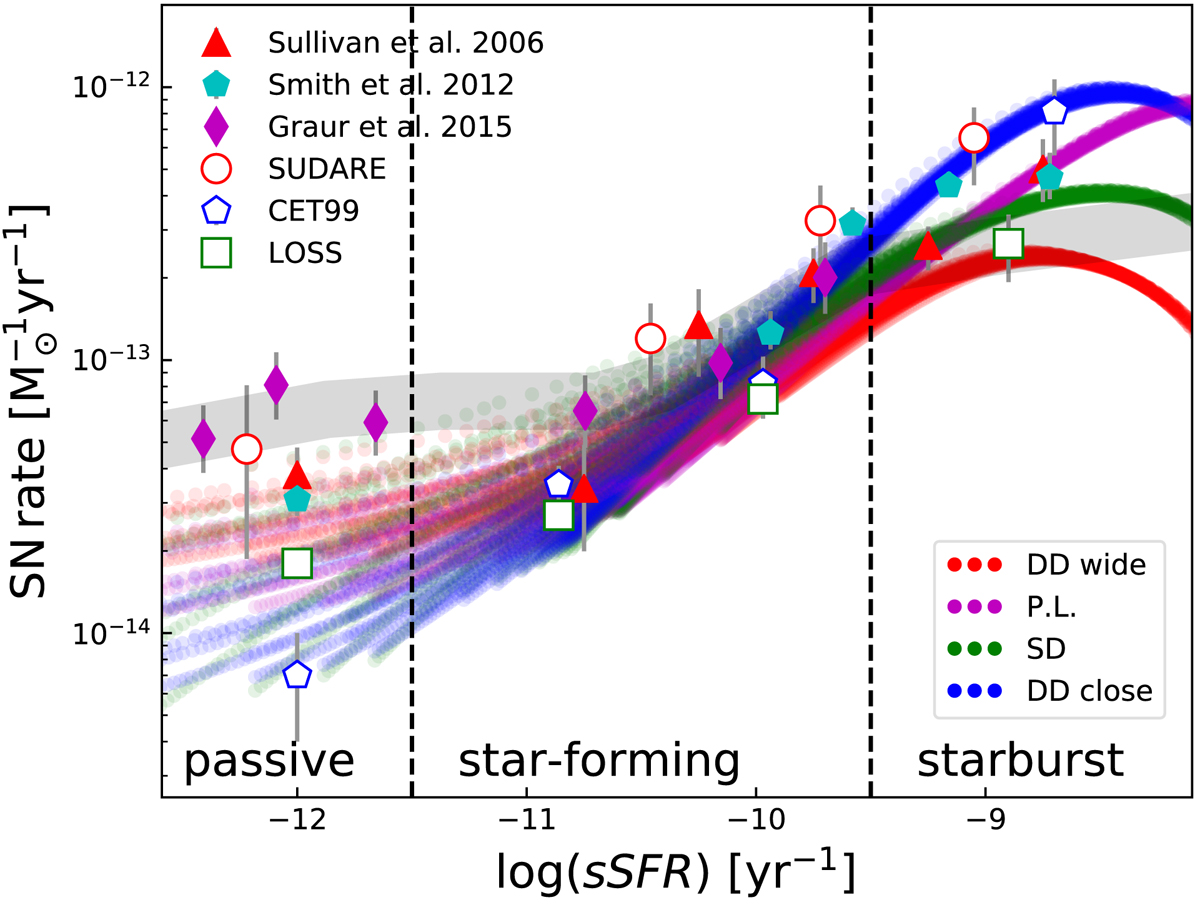
Correlation between the rate of SNIa and the specific SFR of the parent galaxy. Filled circles show our models computed with the log-normal SFH; the colour encoding is the same as in Fig. 10. Open symbols show our measurements on the SUDARE, CET99, and LOSS data. For the local surveys we adopt the piece-wise relation between the M/LK ratio and the B − K colour. The filled triangles, pentagons, and diamonds show literature data (see legend in the top left corner). The grey stripe shows the result of the simulations in Graur et al. (2015).
Current usage metrics show cumulative count of Article Views (full-text article views including HTML views, PDF and ePub downloads, according to the available data) and Abstracts Views on Vision4Press platform.
Data correspond to usage on the plateform after 2015. The current usage metrics is available 48-96 hours after online publication and is updated daily on week days.
Initial download of the metrics may take a while.