Fig. 10.
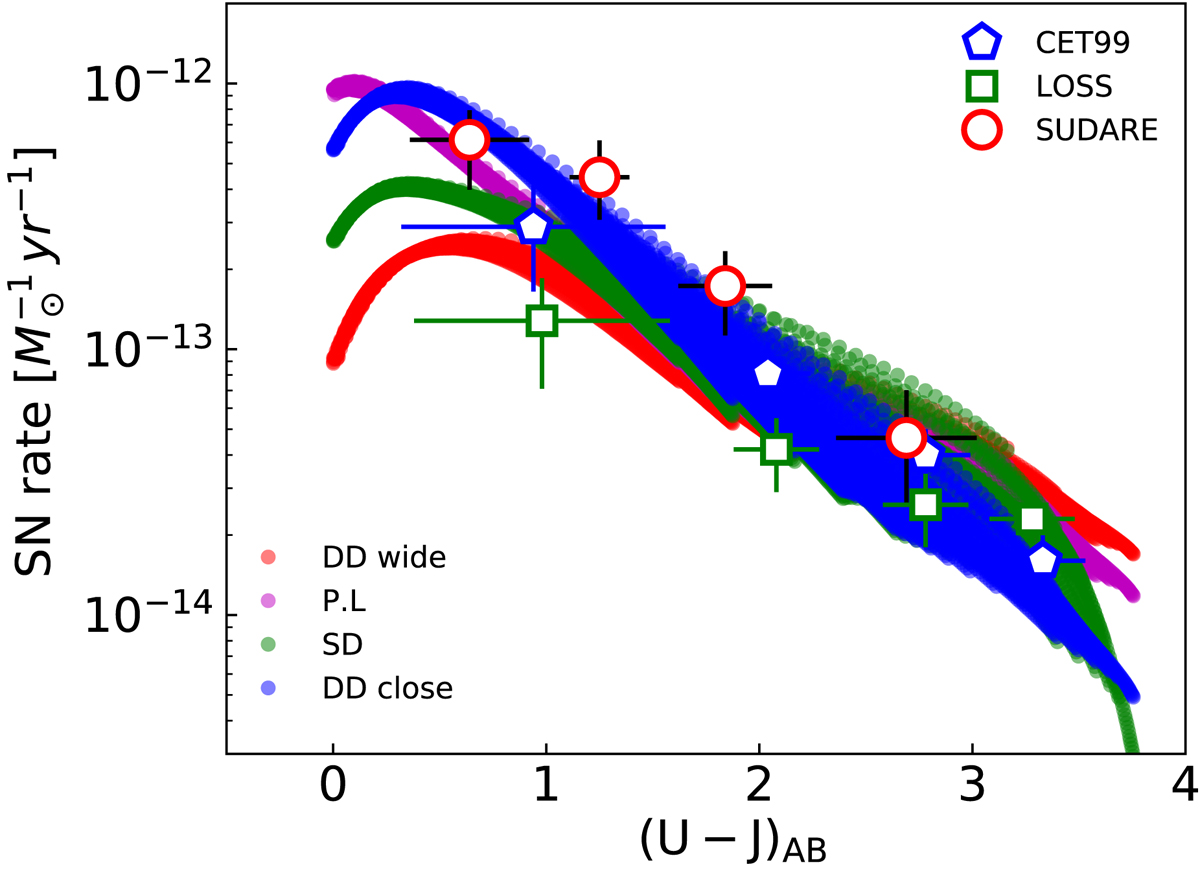
Models computed with the log-normal SFH and the four options for the DTD considered here (filled symbols) compared to data (empty symbols). Predictions obtained with different DTDs are plotted with different colours as labelled. For each DTD we adopt the best fitting value for kIa, namely kIa = (0.74,0.77,0.89 and 0.69) × 10−3 1/M⊙ for the SD, P.L., DD CLOSE and DD WIDE DTDs, respectively (see Appendix B). The symbols encoding of the observed rates is the same as in Fig. 8.
Current usage metrics show cumulative count of Article Views (full-text article views including HTML views, PDF and ePub downloads, according to the available data) and Abstracts Views on Vision4Press platform.
Data correspond to usage on the plateform after 2015. The current usage metrics is available 48-96 hours after online publication and is updated daily on week days.
Initial download of the metrics may take a while.