Fig. 6
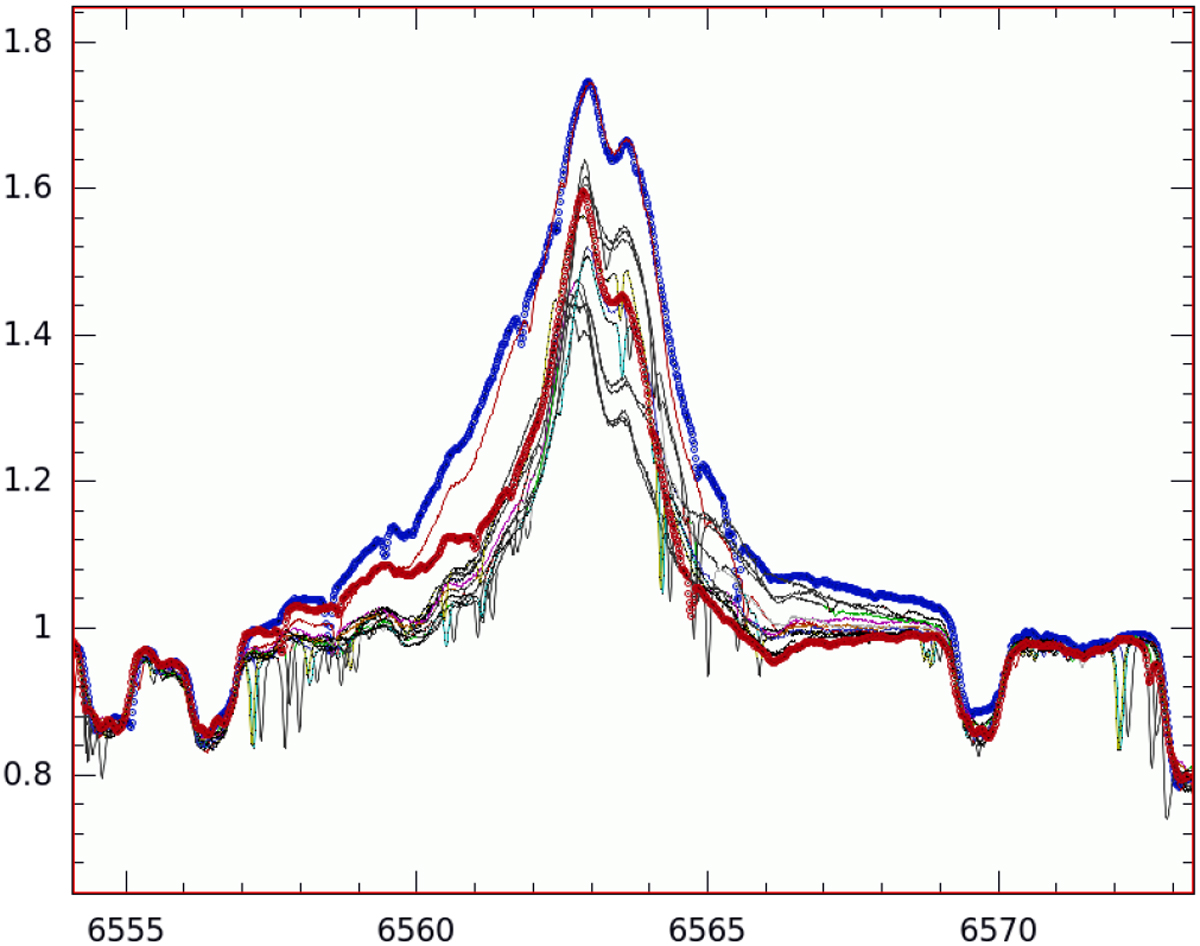
Hα line-profiles changes during the time of the Doppler imaging (wavelengths in Å). The blue-colored line profile is for phase 0.348 when the hot/cool spot pair Band C is close to crossing the stellar central meridian. The red-colored line profile is the profile at the preceding phase 0.198 while the profile in-between these two profiles (thin line) is for phase 0.386.
Current usage metrics show cumulative count of Article Views (full-text article views including HTML views, PDF and ePub downloads, according to the available data) and Abstracts Views on Vision4Press platform.
Data correspond to usage on the plateform after 2015. The current usage metrics is available 48-96 hours after online publication and is updated daily on week days.
Initial download of the metrics may take a while.