Fig. 1
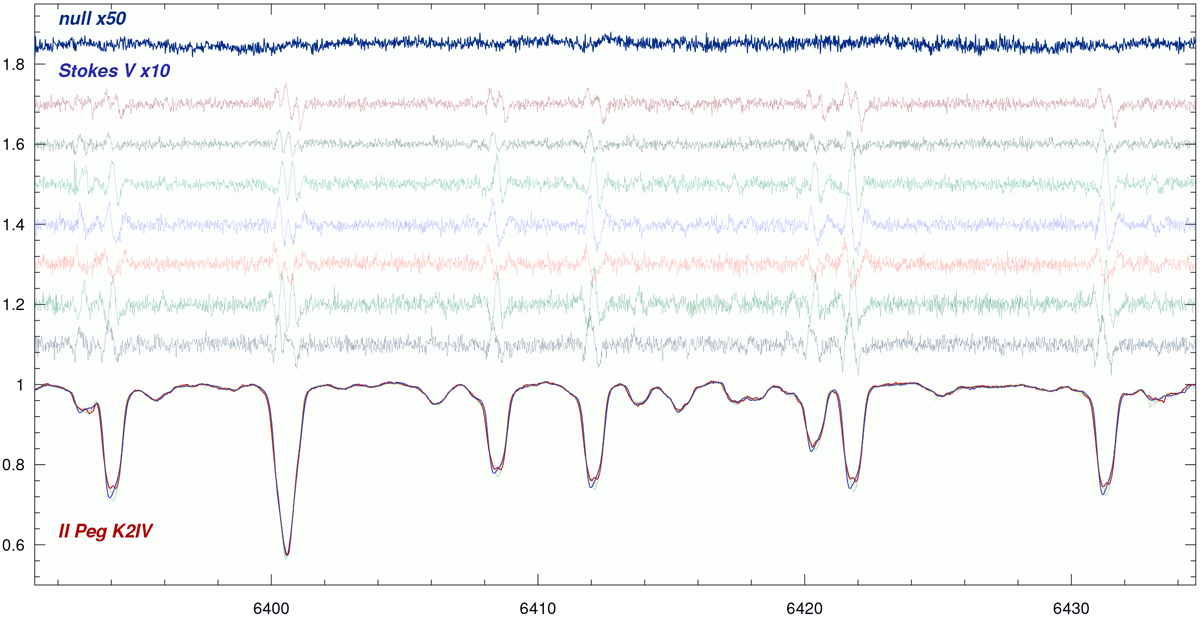
Spectra for an example wavelength region around 6400 Å. The bottom spectra are seven overplotted Stokes I spectra for one spectrum per night (out of the 14 rotational phases of the full time series). Note that the rotation period of II Peg is 6.7 d. On top of it are the same seven Stokes V spectra for the seven consecutive nights but shifted in relative intensity by 0.1 and enhanced in scale by a factor of ten with respect to Stokes I. Time increases from bottom to top. The very top spectrum is the null spectrum enhanced by a factor 50 with respect to Stokes I.
Current usage metrics show cumulative count of Article Views (full-text article views including HTML views, PDF and ePub downloads, according to the available data) and Abstracts Views on Vision4Press platform.
Data correspond to usage on the plateform after 2015. The current usage metrics is available 48-96 hours after online publication and is updated daily on week days.
Initial download of the metrics may take a while.