Fig. 4.
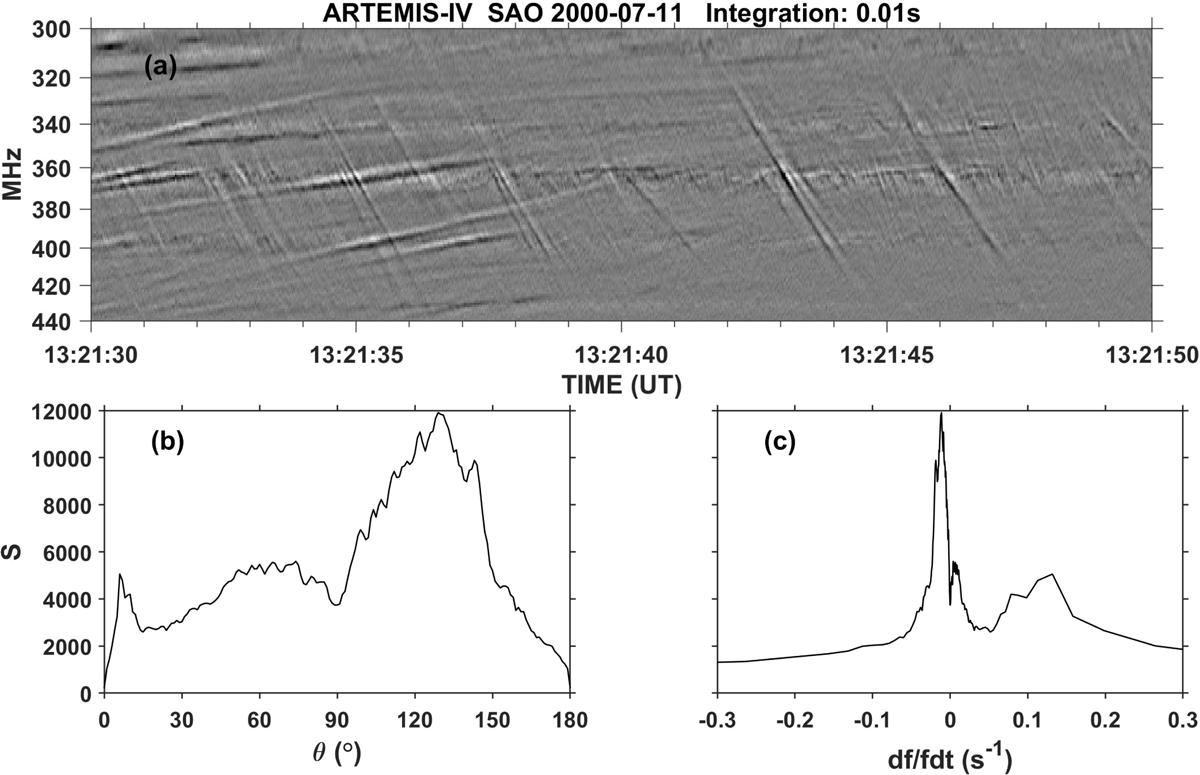
Panel a: dynamic spectrum with two overlapping groups of intermediate drift bursts. Panel b: amplitude of the corresponding power spectrum as a function of the polar angle on the FT plane. Panel c: same amplitude as a function of drift rate. The two peaks at 6° and 129° correspond to drift rates of 0.132 s−1 (FDB) and −0.012 s−1 (typical fiber group) respectively.
Current usage metrics show cumulative count of Article Views (full-text article views including HTML views, PDF and ePub downloads, according to the available data) and Abstracts Views on Vision4Press platform.
Data correspond to usage on the plateform after 2015. The current usage metrics is available 48-96 hours after online publication and is updated daily on week days.
Initial download of the metrics may take a while.