Fig. 3.
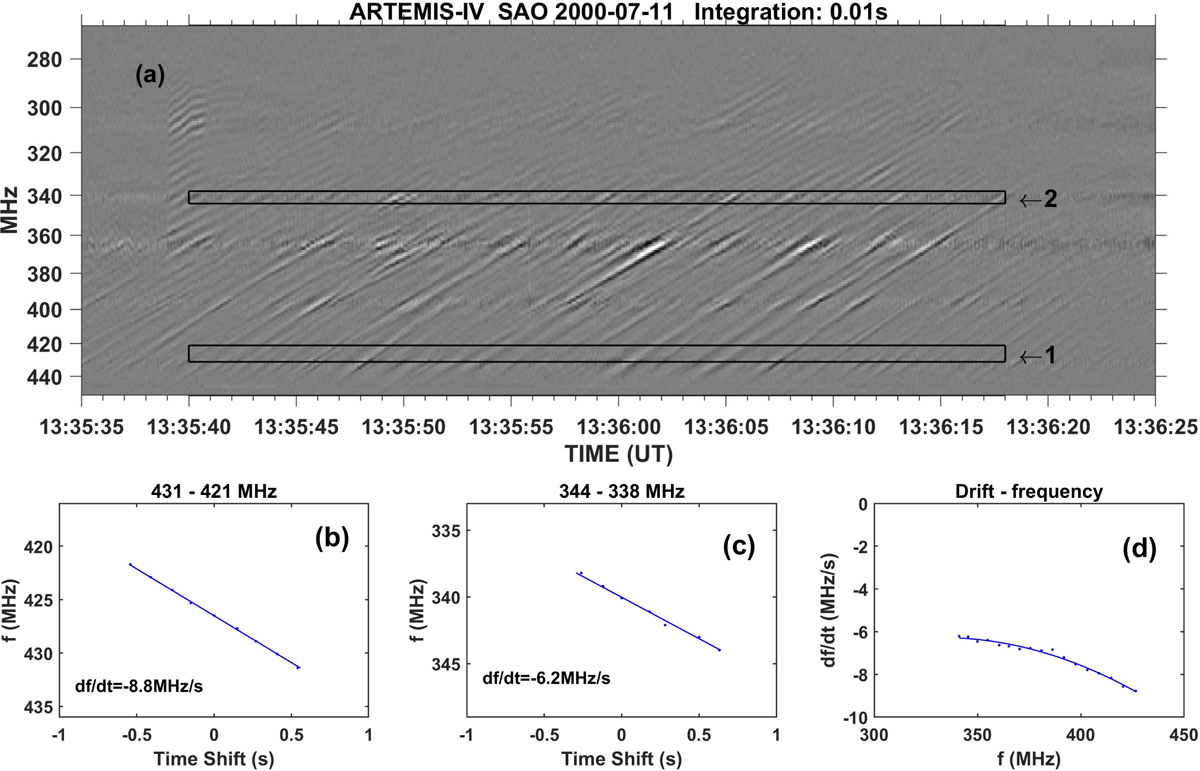
Dynamic spectrum from SAO (panel a) for the fiber group used in the computation of drift rate at a sliding frequency window using cross-correlation on each position of the window. Panels b and c: frequency as a function of time shift from the first and last frequency window, labelled respectively with 1 and 2 in dynamic spectrum. Panel d: variation of the drift rate with frequency.
Current usage metrics show cumulative count of Article Views (full-text article views including HTML views, PDF and ePub downloads, according to the available data) and Abstracts Views on Vision4Press platform.
Data correspond to usage on the plateform after 2015. The current usage metrics is available 48-96 hours after online publication and is updated daily on week days.
Initial download of the metrics may take a while.